

Monitoring Console Pages
The Monitoring group in Dagu Console's sidebar holds these pages. Every member of the workspace can view them. Only workspace owners can delete reports, disconnect servers, mute workflows, and change who gets alert emails. See Monitoring (Beta) to connect a server.
Overview
- Servers reporting, Failed today (UTC), Open alerts, and Success (7 UTC days).
- Needs attention: problems to act on, each naming the servers it affects: Not reporting, Not checking in, Offline, Scheduler stopped, Failing workflows, Events lost, Monitoring off, and, for owners, Over capacity.
- Open alerts and Failures today (UTC), up to 10 of each. Failures include aborted and rejected runs.
Servers
Connected servers lists each server with its status, Dagu version, last report, failures today (UTC), success rate over 7 UTC days, and open alerts.
| Status | Meaning |
|---|---|
| Reporting | A report arrived in the last 5 minutes. |
| Not reporting | The server reported before, but not in the last 5 minutes. |
| Not checking in | The server has not checked in with its license for more than 26 hours. |
| Offline | The server has not checked in with its license for more than 72 hours. |
| Monitoring off | The server reported that monitoring was turned off, or Dagu Console holds no report from it: monitoring was never turned on, or its reports were deleted. |
Scheduler stopped appears next to the status when the last report counts no running scheduler, so scheduled workflows do not start.
Each server's page has these tabs:
- Overview: the server's details, such as its ID, Dagu version, OS and architecture, process start, last report, whether stopped-reporting alerts are on, and last check-in; the services from the last report; open alerts; and failures in the last 14 days.
- Runs: the server's runs.
- Workflows: each workflow's finished runs per UTC day over the last 14 days as bars, with runs, failures, success rate, and average and longest duration. Failing marks a workflow with an open alert, and Muted a muted one.
- Settings, for owners: Alerts, Delete reports, and Disconnect server.
Runs
Runs in progress come first, then finished runs, newest recorded first. Filter by:
- Server
- Workflow
- Status: Failed (including aborted and rejected), Succeeded (including partially succeeded), Running, Waiting, or Queued
- Range: Last hour, Last 24 hours (default), Last 7 days, or Last 14 days, by when Dagu Console recorded the run
Each run has a permalink to a page that lists its attempts. A run in progress on a server that has not reported for 5 minutes shows Unknown. A workflow's name opens its page.
Alerts
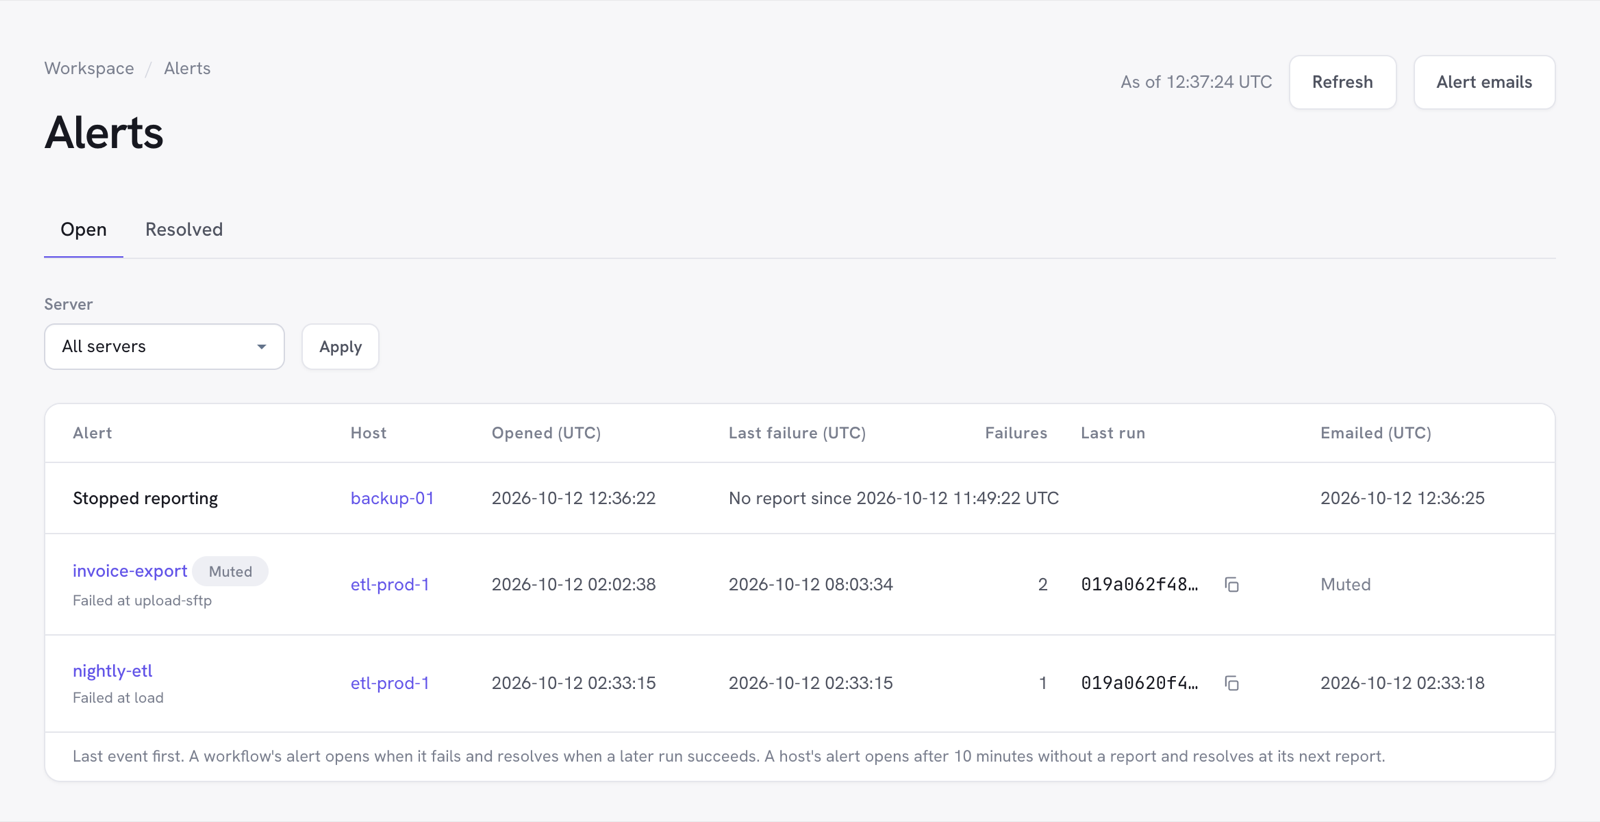
Open and Resolved alerts, filtered by server. A workflow's alert shows the workflow, the server, when it opened, the last failure, the number of failures, the last run, and the failed steps. A server's stopped-reporting alert shows how long the server has been silent, or was.
Emailed (UTC) shows when the alert was emailed, or why it was not.
Owners see Alert emails, which opens the recipients.
Insights
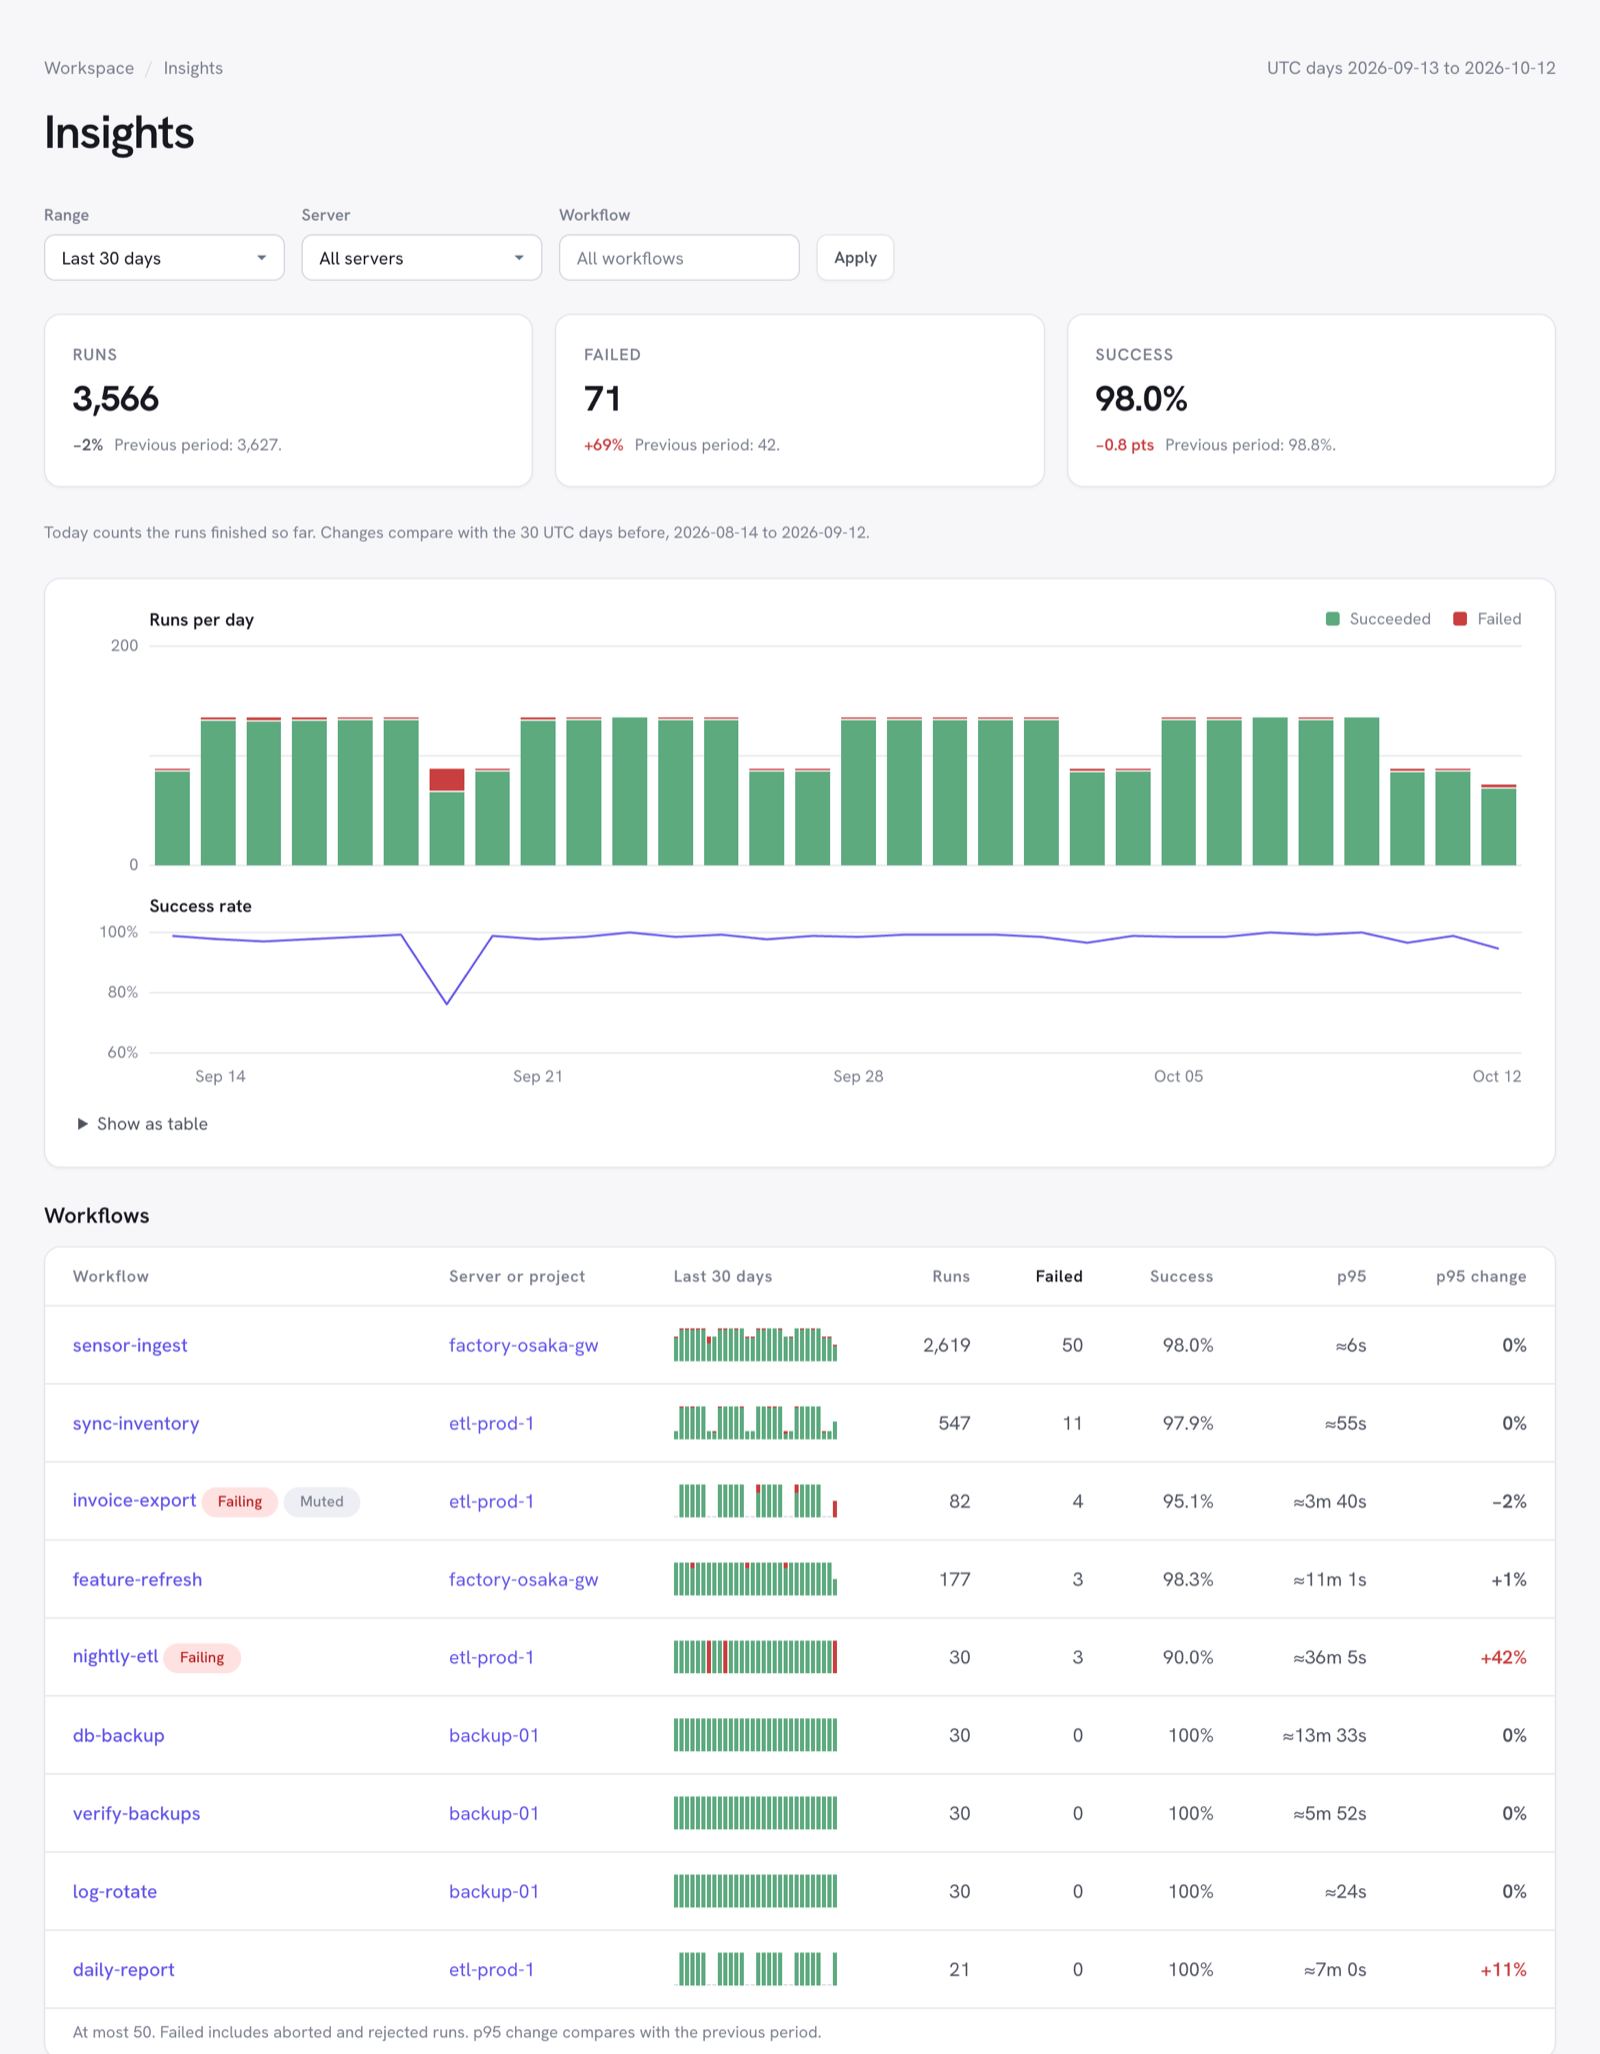
Insights shows how the workspace's workflows went over the last 7, 30, or 90 UTC days, today's runs so far included, against as many days before.
- Runs, Failed, and Success, each with its change against the previous period. A change is shown only when both periods have at least 10 runs.
- Runs per day, succeeded and failed, and Success rate. Show as table lists the same numbers.
- Workflows: up to 50, each with a bar per day, runs, failed, success, p95 duration, and its change against the previous period. Sort by workflow, runs, failed, success, p95, or p95 change. Failing marks a workflow with an open alert, and Muted a muted one.
Filter by Server and Workflow.
Workflow Pages
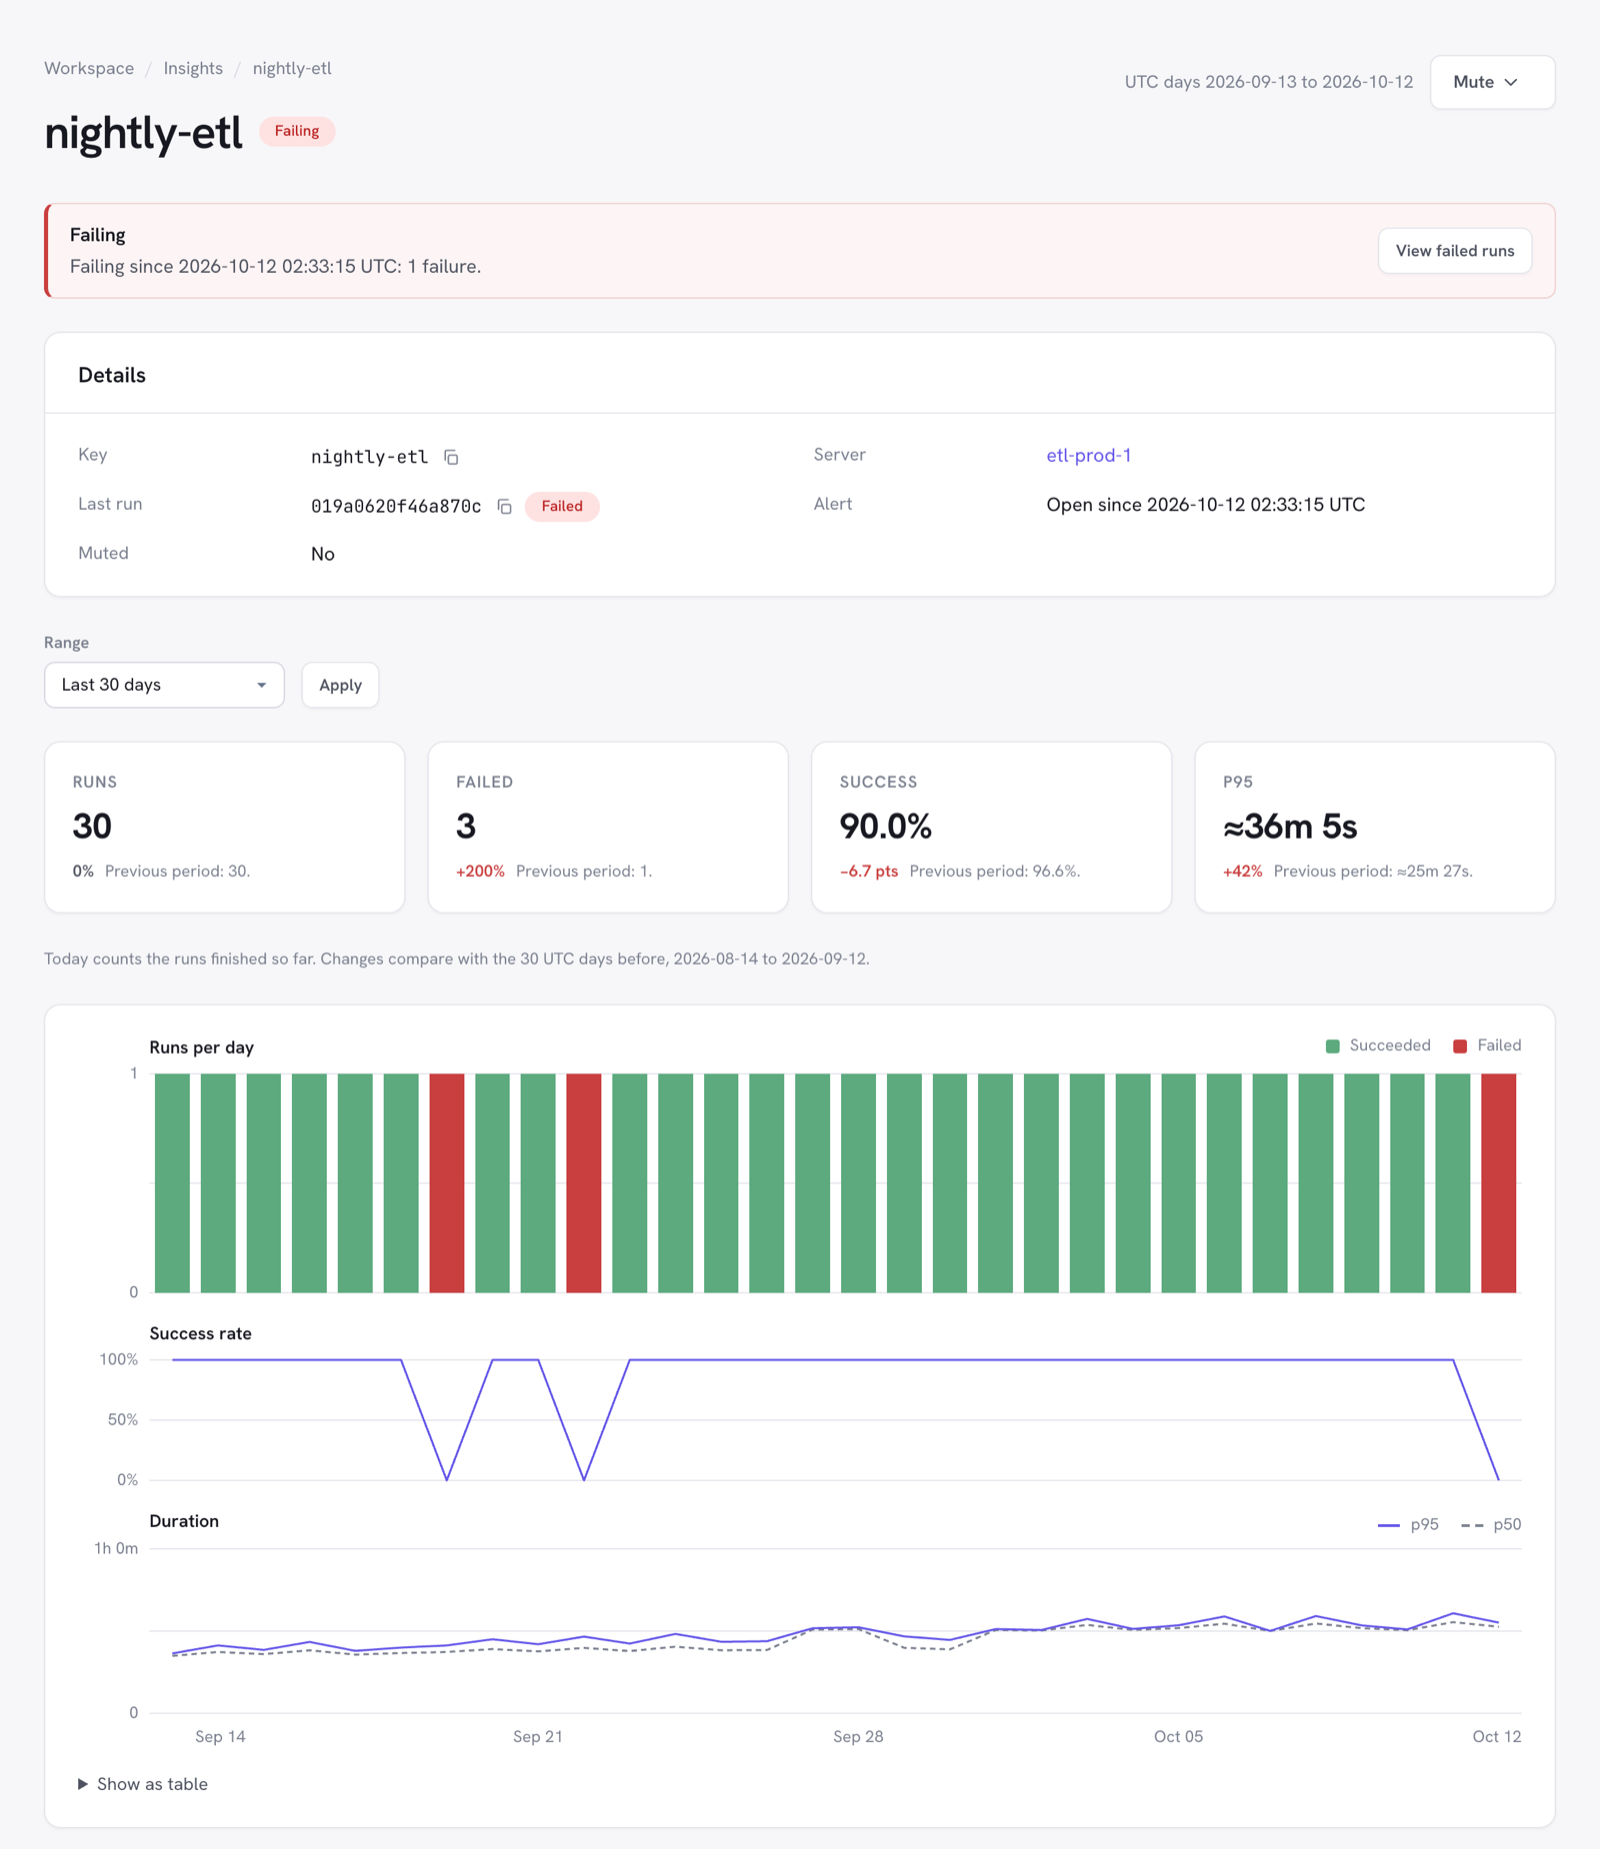
A workflow's name in Insights, Runs, Alerts, or a server's Workflows tab opens its page:
- Details: the workflow's key, server, last run, open alert, and whether it is muted.
- Over 7, 30, or 90 UTC days: Runs, Failed, Success, and p95, with Runs per day, Success rate, and Duration (p50 and p95) charts.
- Recent runs: the last 10 finished runs. View all lists the rest on Runs.
- Failures by step: failed, aborted, and rejected runs over the last 14 days, by the step they failed at.
- For owners: Mute or Unmute.
Dagu Console counts each day's run durations in ranges, from under a second to 8 hours or more, rather than keeping every duration. p50 and p95 are estimated from those ranges, so they show as approximate (≈), and they are never longer than the longest run. Days before 2026-10-13 (UTC) may have no estimate.