Web UI
Use Dagu's web UI to run workflows, inspect results, edit DAGs, review logs, and manage the server from a browser.
Start the UI
dagu start-allThen open http://localhost:8080.
To bind a different address or port:
dagu start-all --host 0.0.0.0 --port 9000Main Areas
Dagu's UI is organized around a few everyday jobs:
- Cockpit for a live board of recent runs
- Dashboard for recent activity and trends
- Definitions for the list of workflows
- Run details for outputs, artifacts, logs, and retries
- Notifications for Slack, email, Telegram, and webhook routing
- Incidents for PagerDuty and SolarWinds Incident Response routing
- Profiles for runtime variables and secrets selected when a run starts
- Search for finding workflows quickly
- System Status for scheduler, coordinator, worker, and resource health
Workspace Selector
The workspace selector sits at the top of the navigation and affects workspace-aware pages such as Cockpit, Dashboard, Definitions, Runs, Search, and Design.
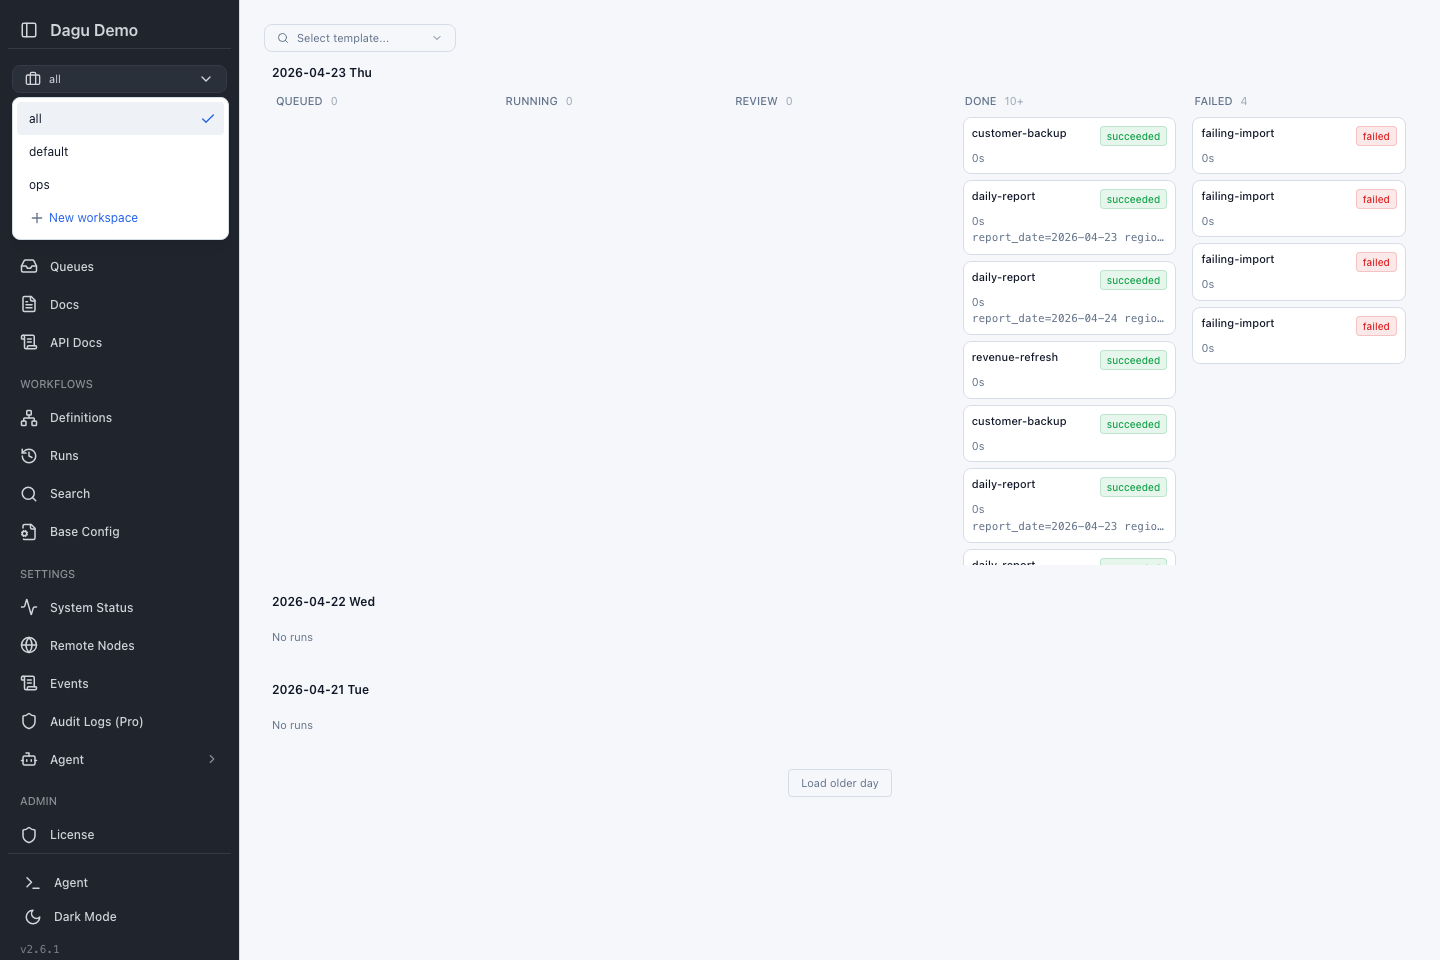
You can switch between:
- all to see everything your account can access
- default to see items with no named workspace
- A named workspace such as
ops
See Workspaces for the full behavior and admin setup.
Cockpit
Cockpit is the quickest way to watch what is happening right now.
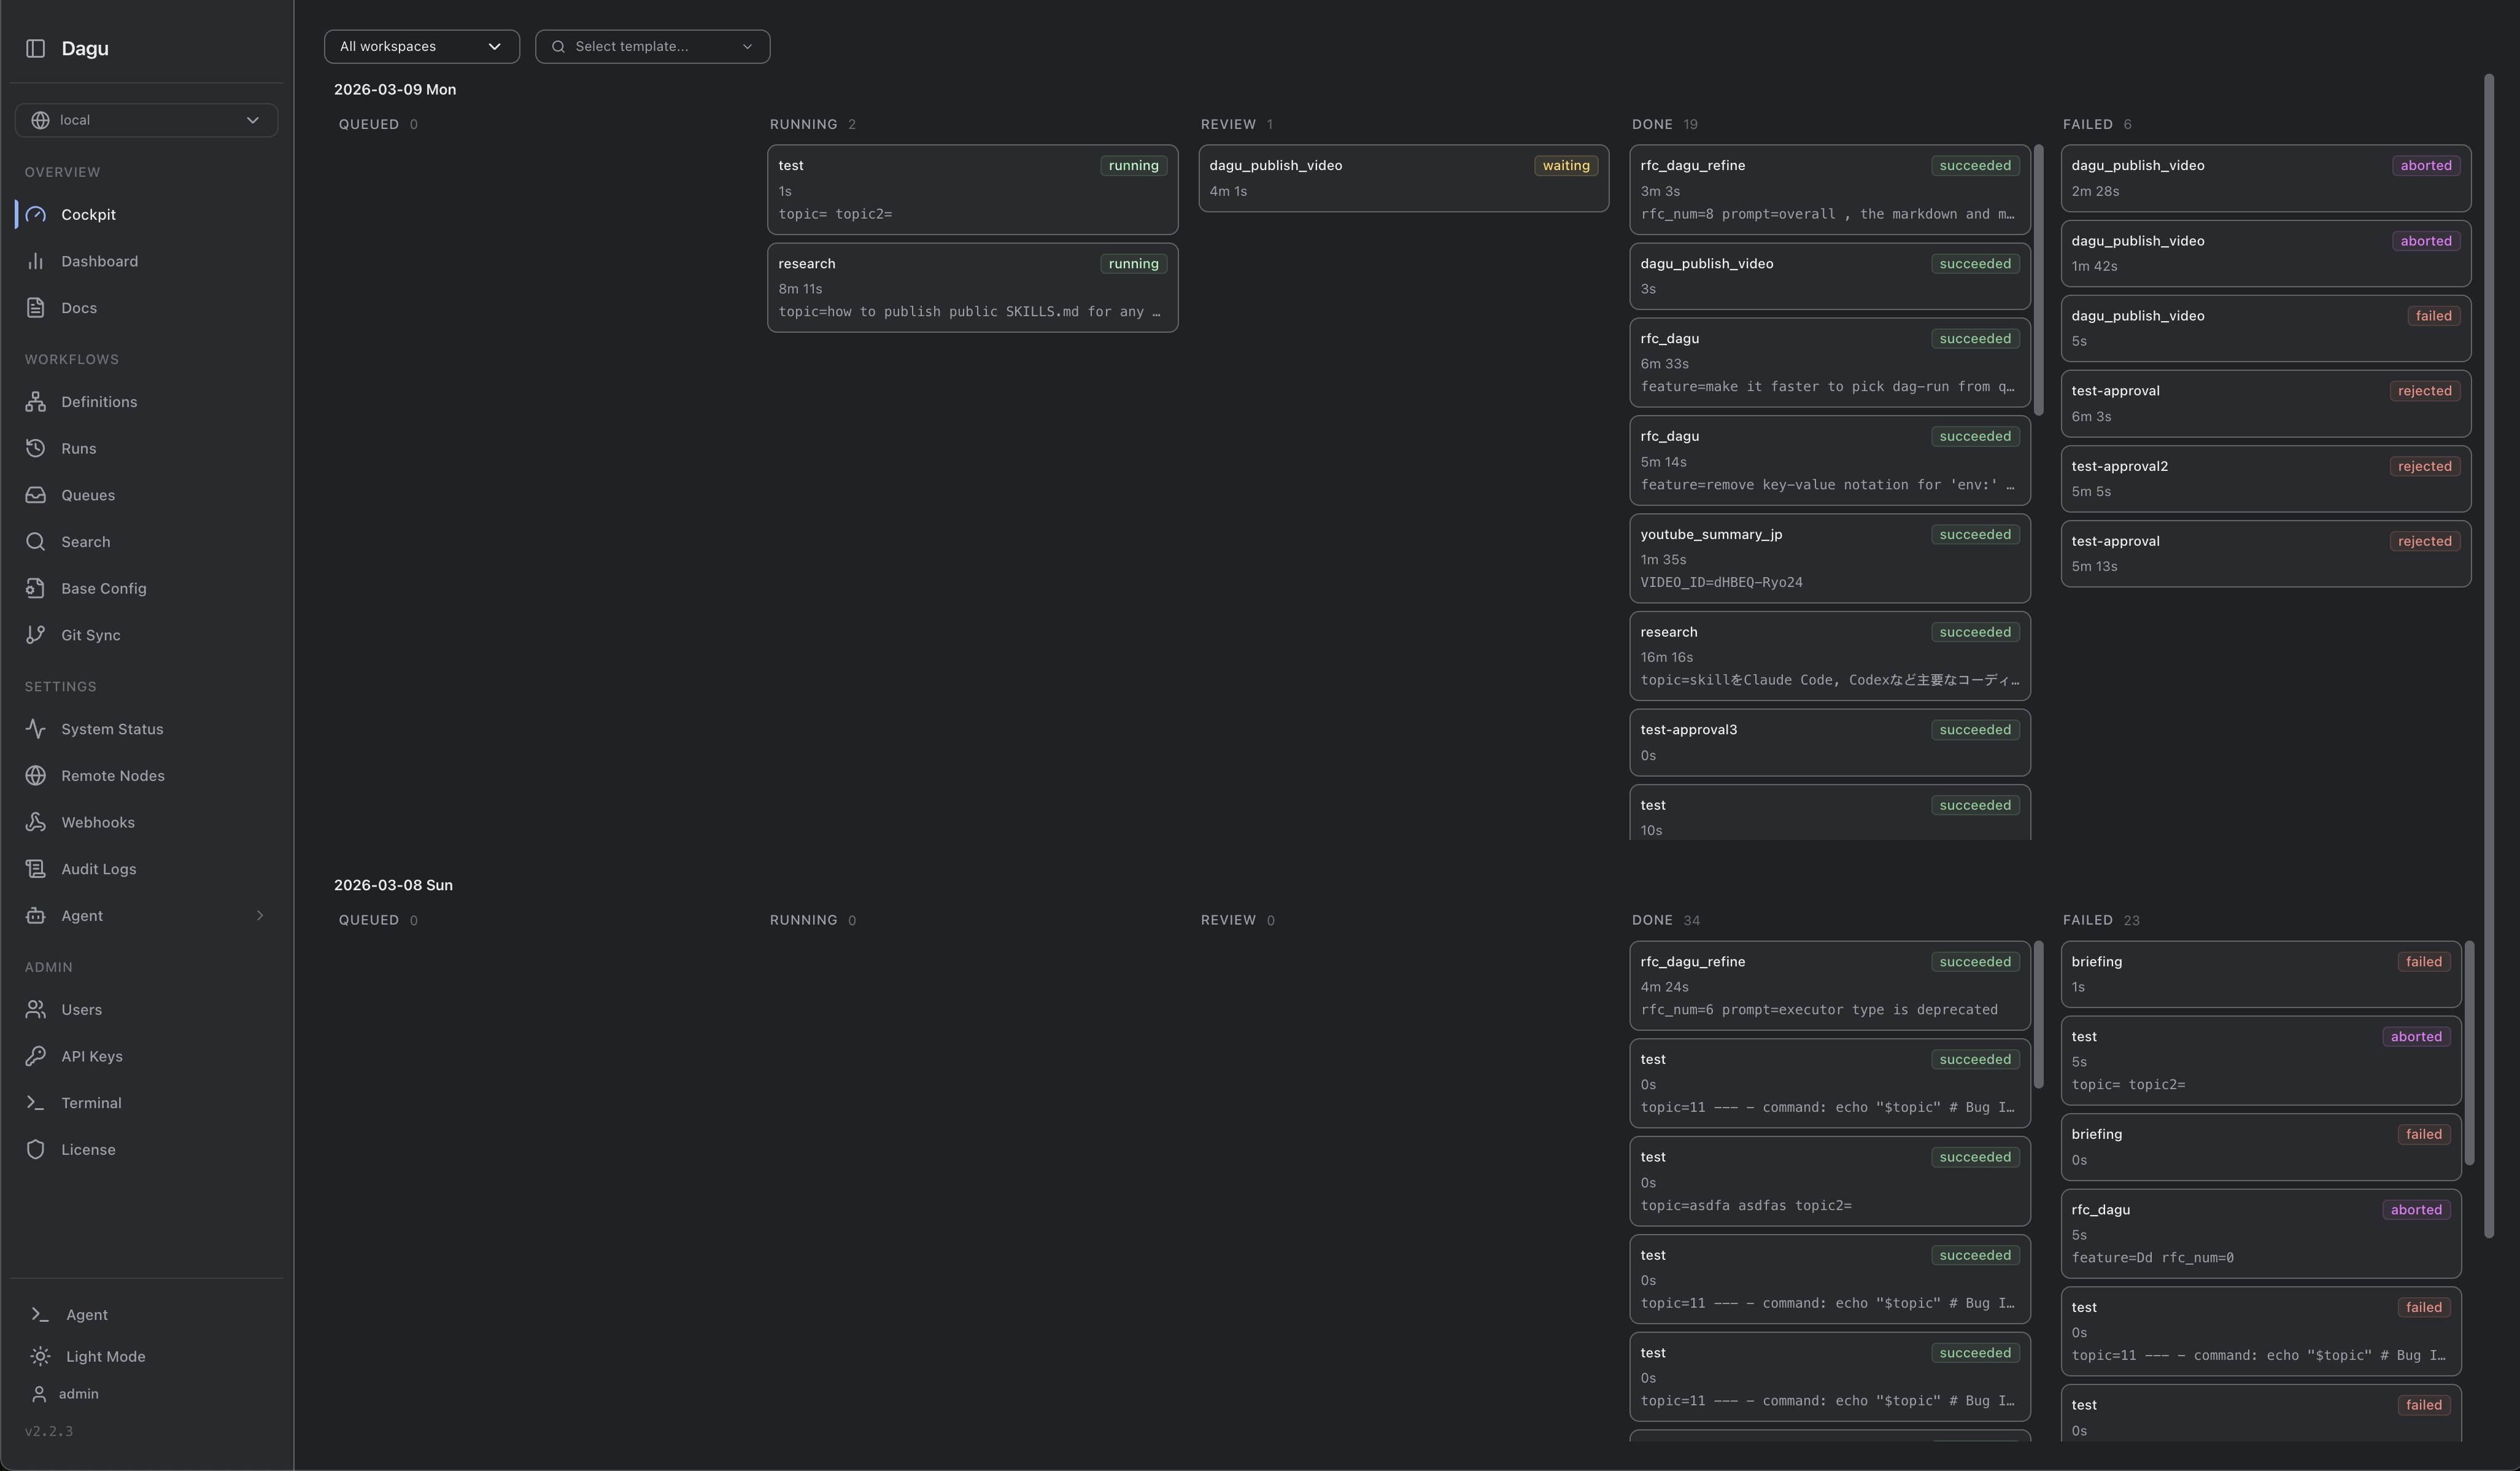
Use it when you want to:
- scan today’s runs by status
- spot failures or stuck work quickly
- open run details without leaving the board
- start or enqueue workflows from the template picker
See Cockpit for the dedicated guide.
Dashboard
The Dashboard gives you a broader operations view than Cockpit.
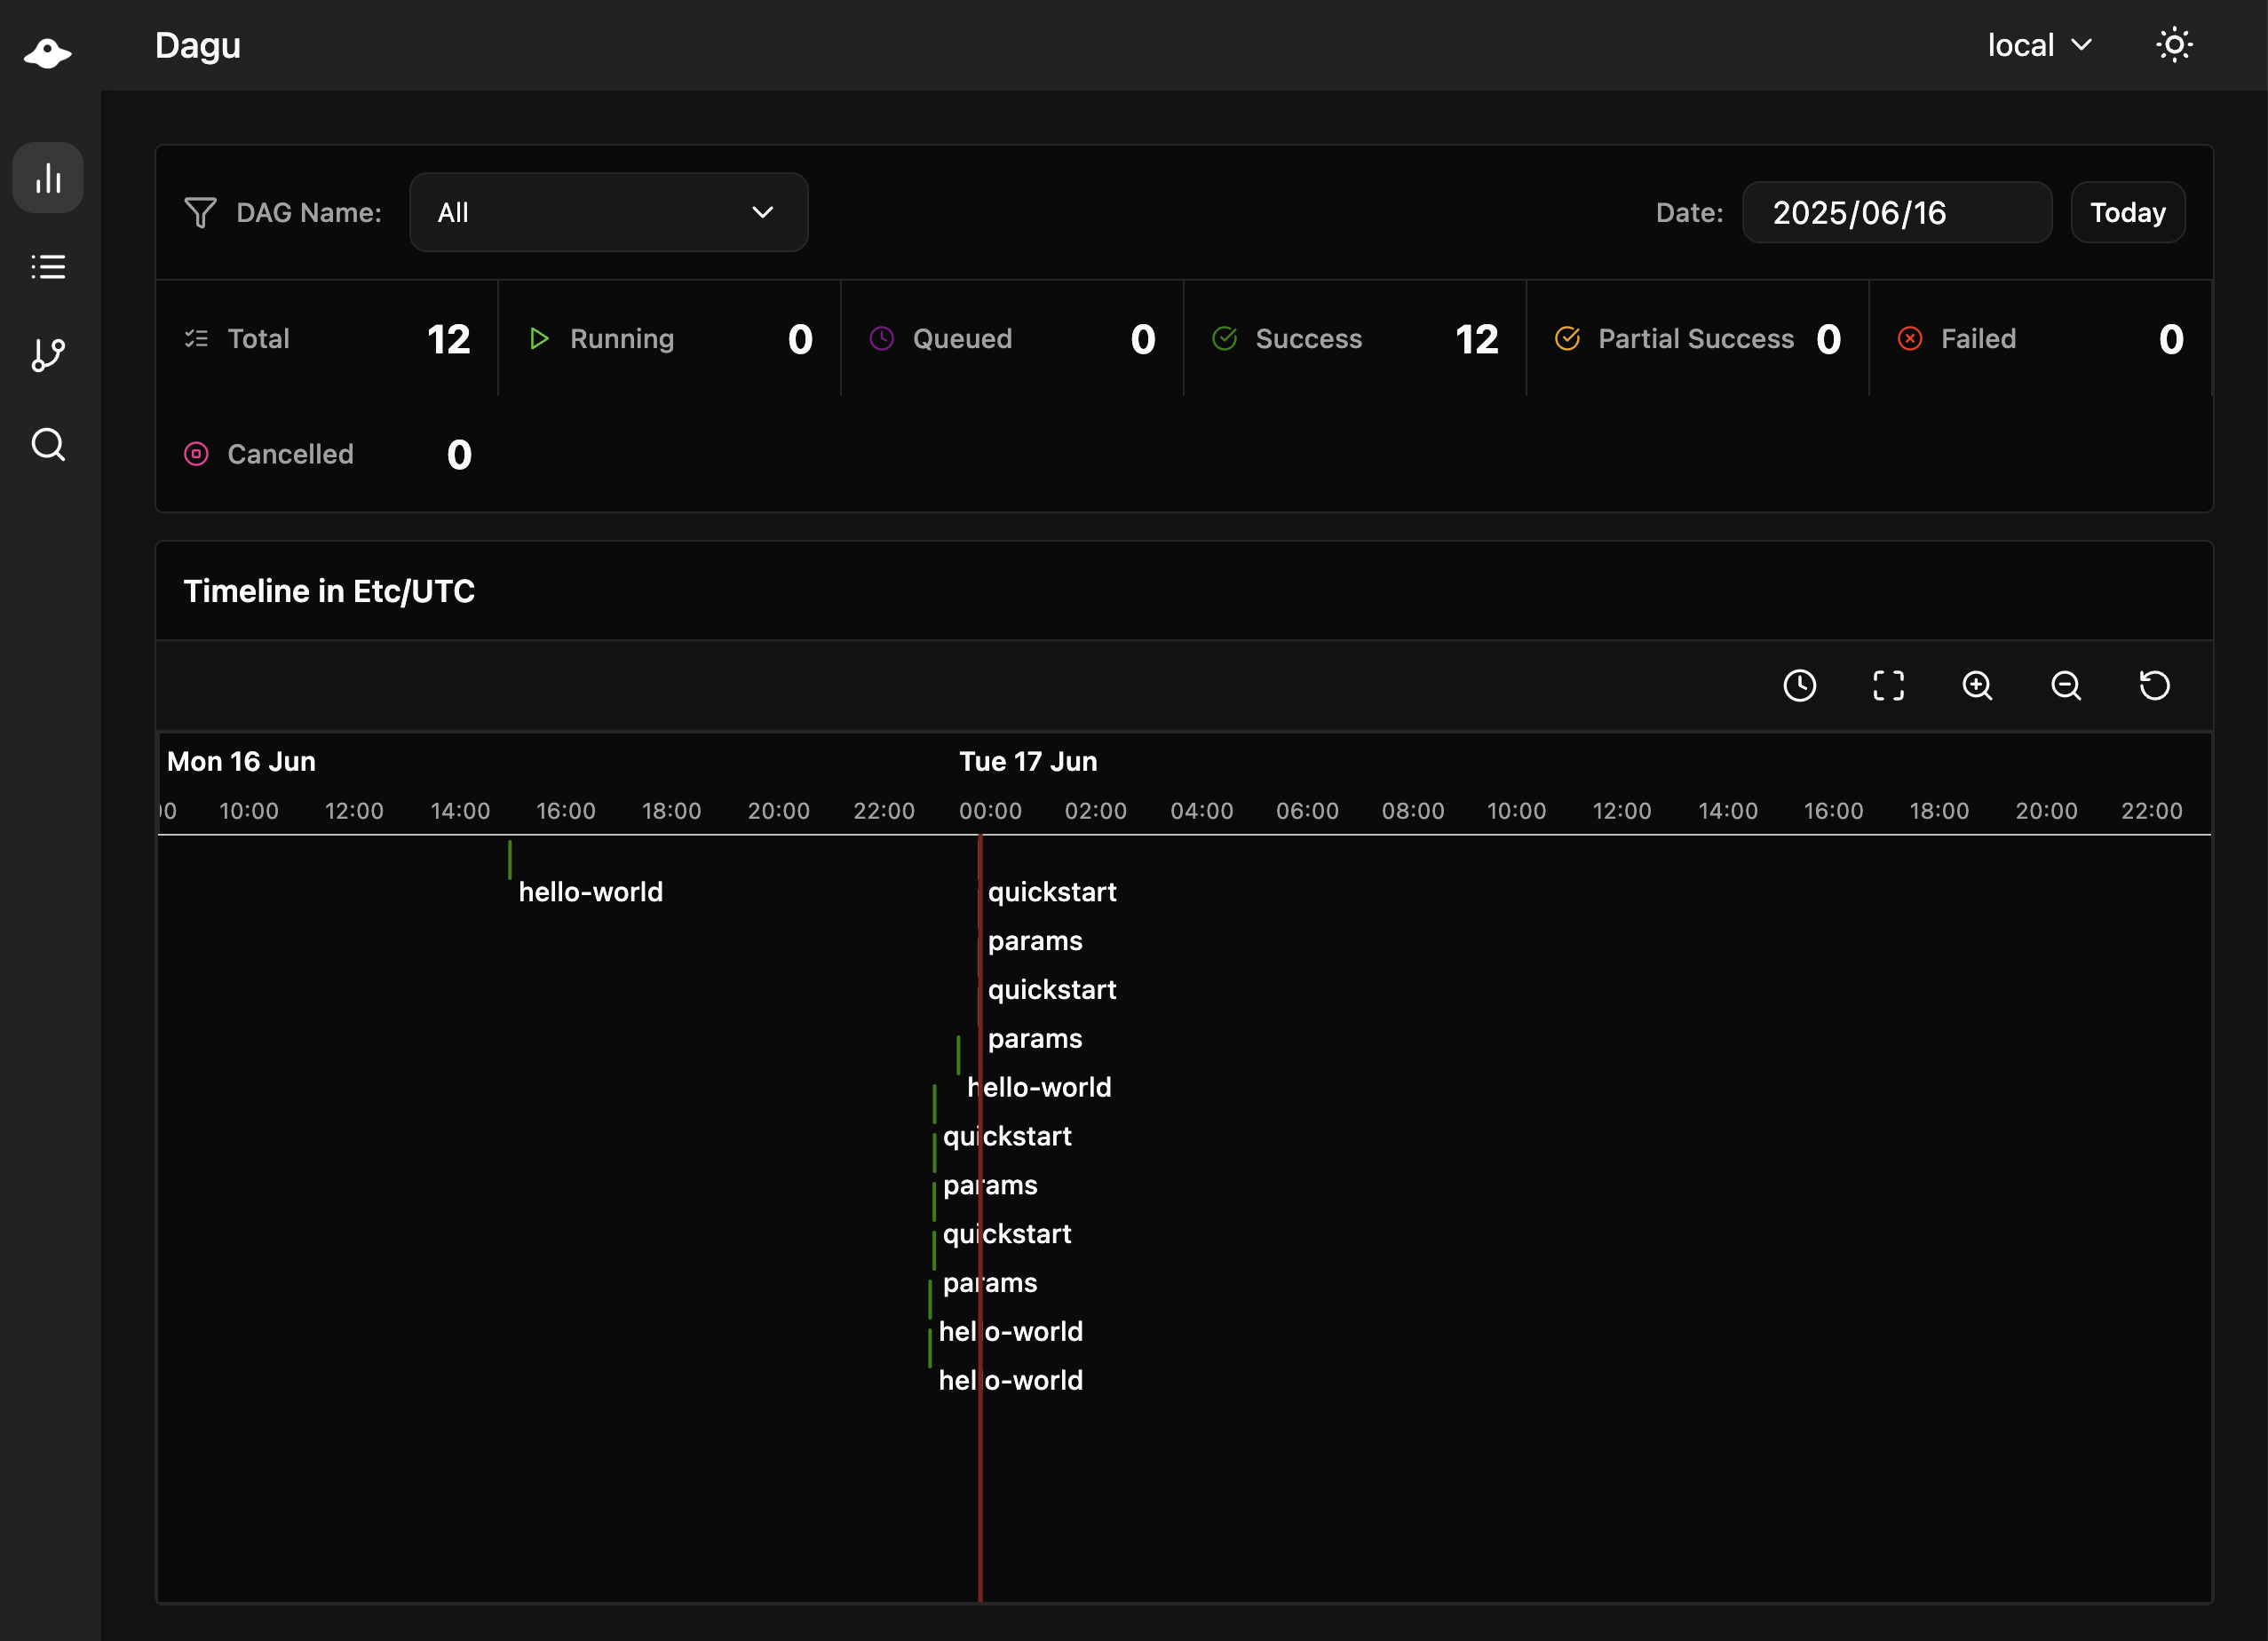
Use it to review:
- recent workflow activity
- success and failure patterns
- filtered run lists by status, date, and name
Definitions
The Definitions page lists every workflow you can access and shows its current state.
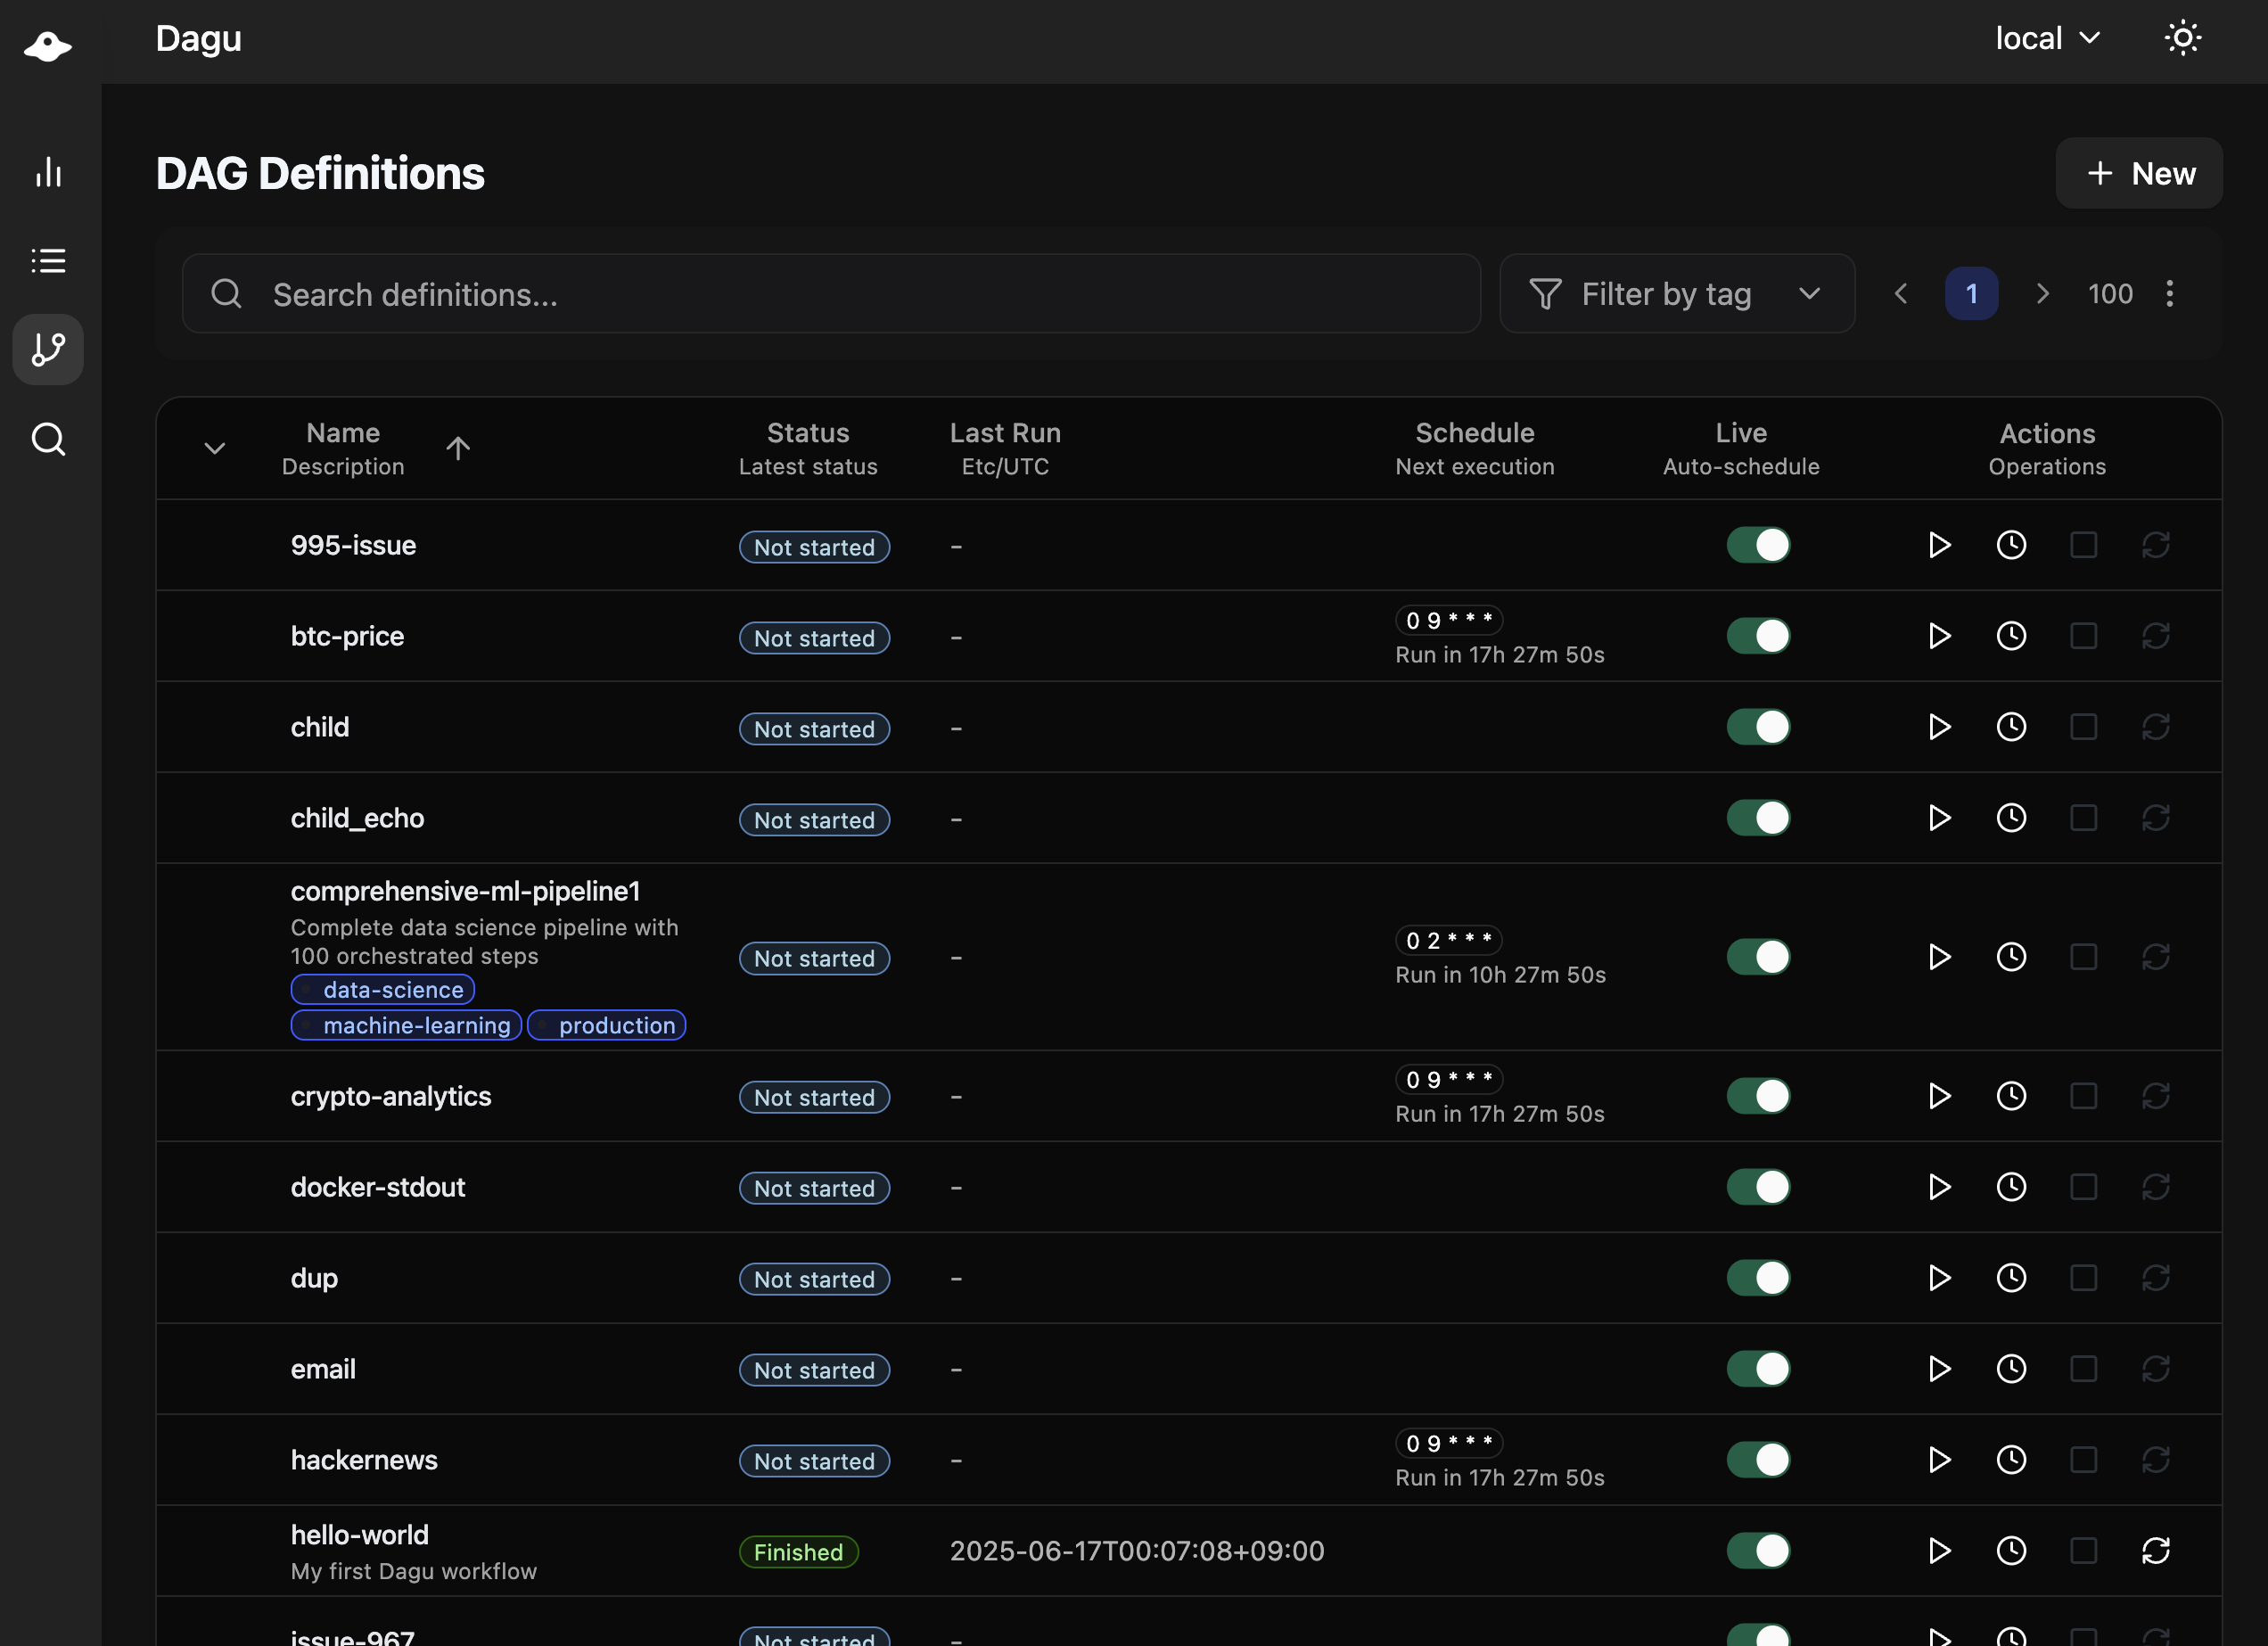
This is the best place to:
- browse workflows by workspace
- open a DAG for details or editing
- start or enqueue a workflow from its detail view
- see whether a workflow is scheduled, suspended, or recently failed
Workflow Details
Open any workflow from Definitions to inspect its latest run, schedule, webhook settings, history, and YAML.
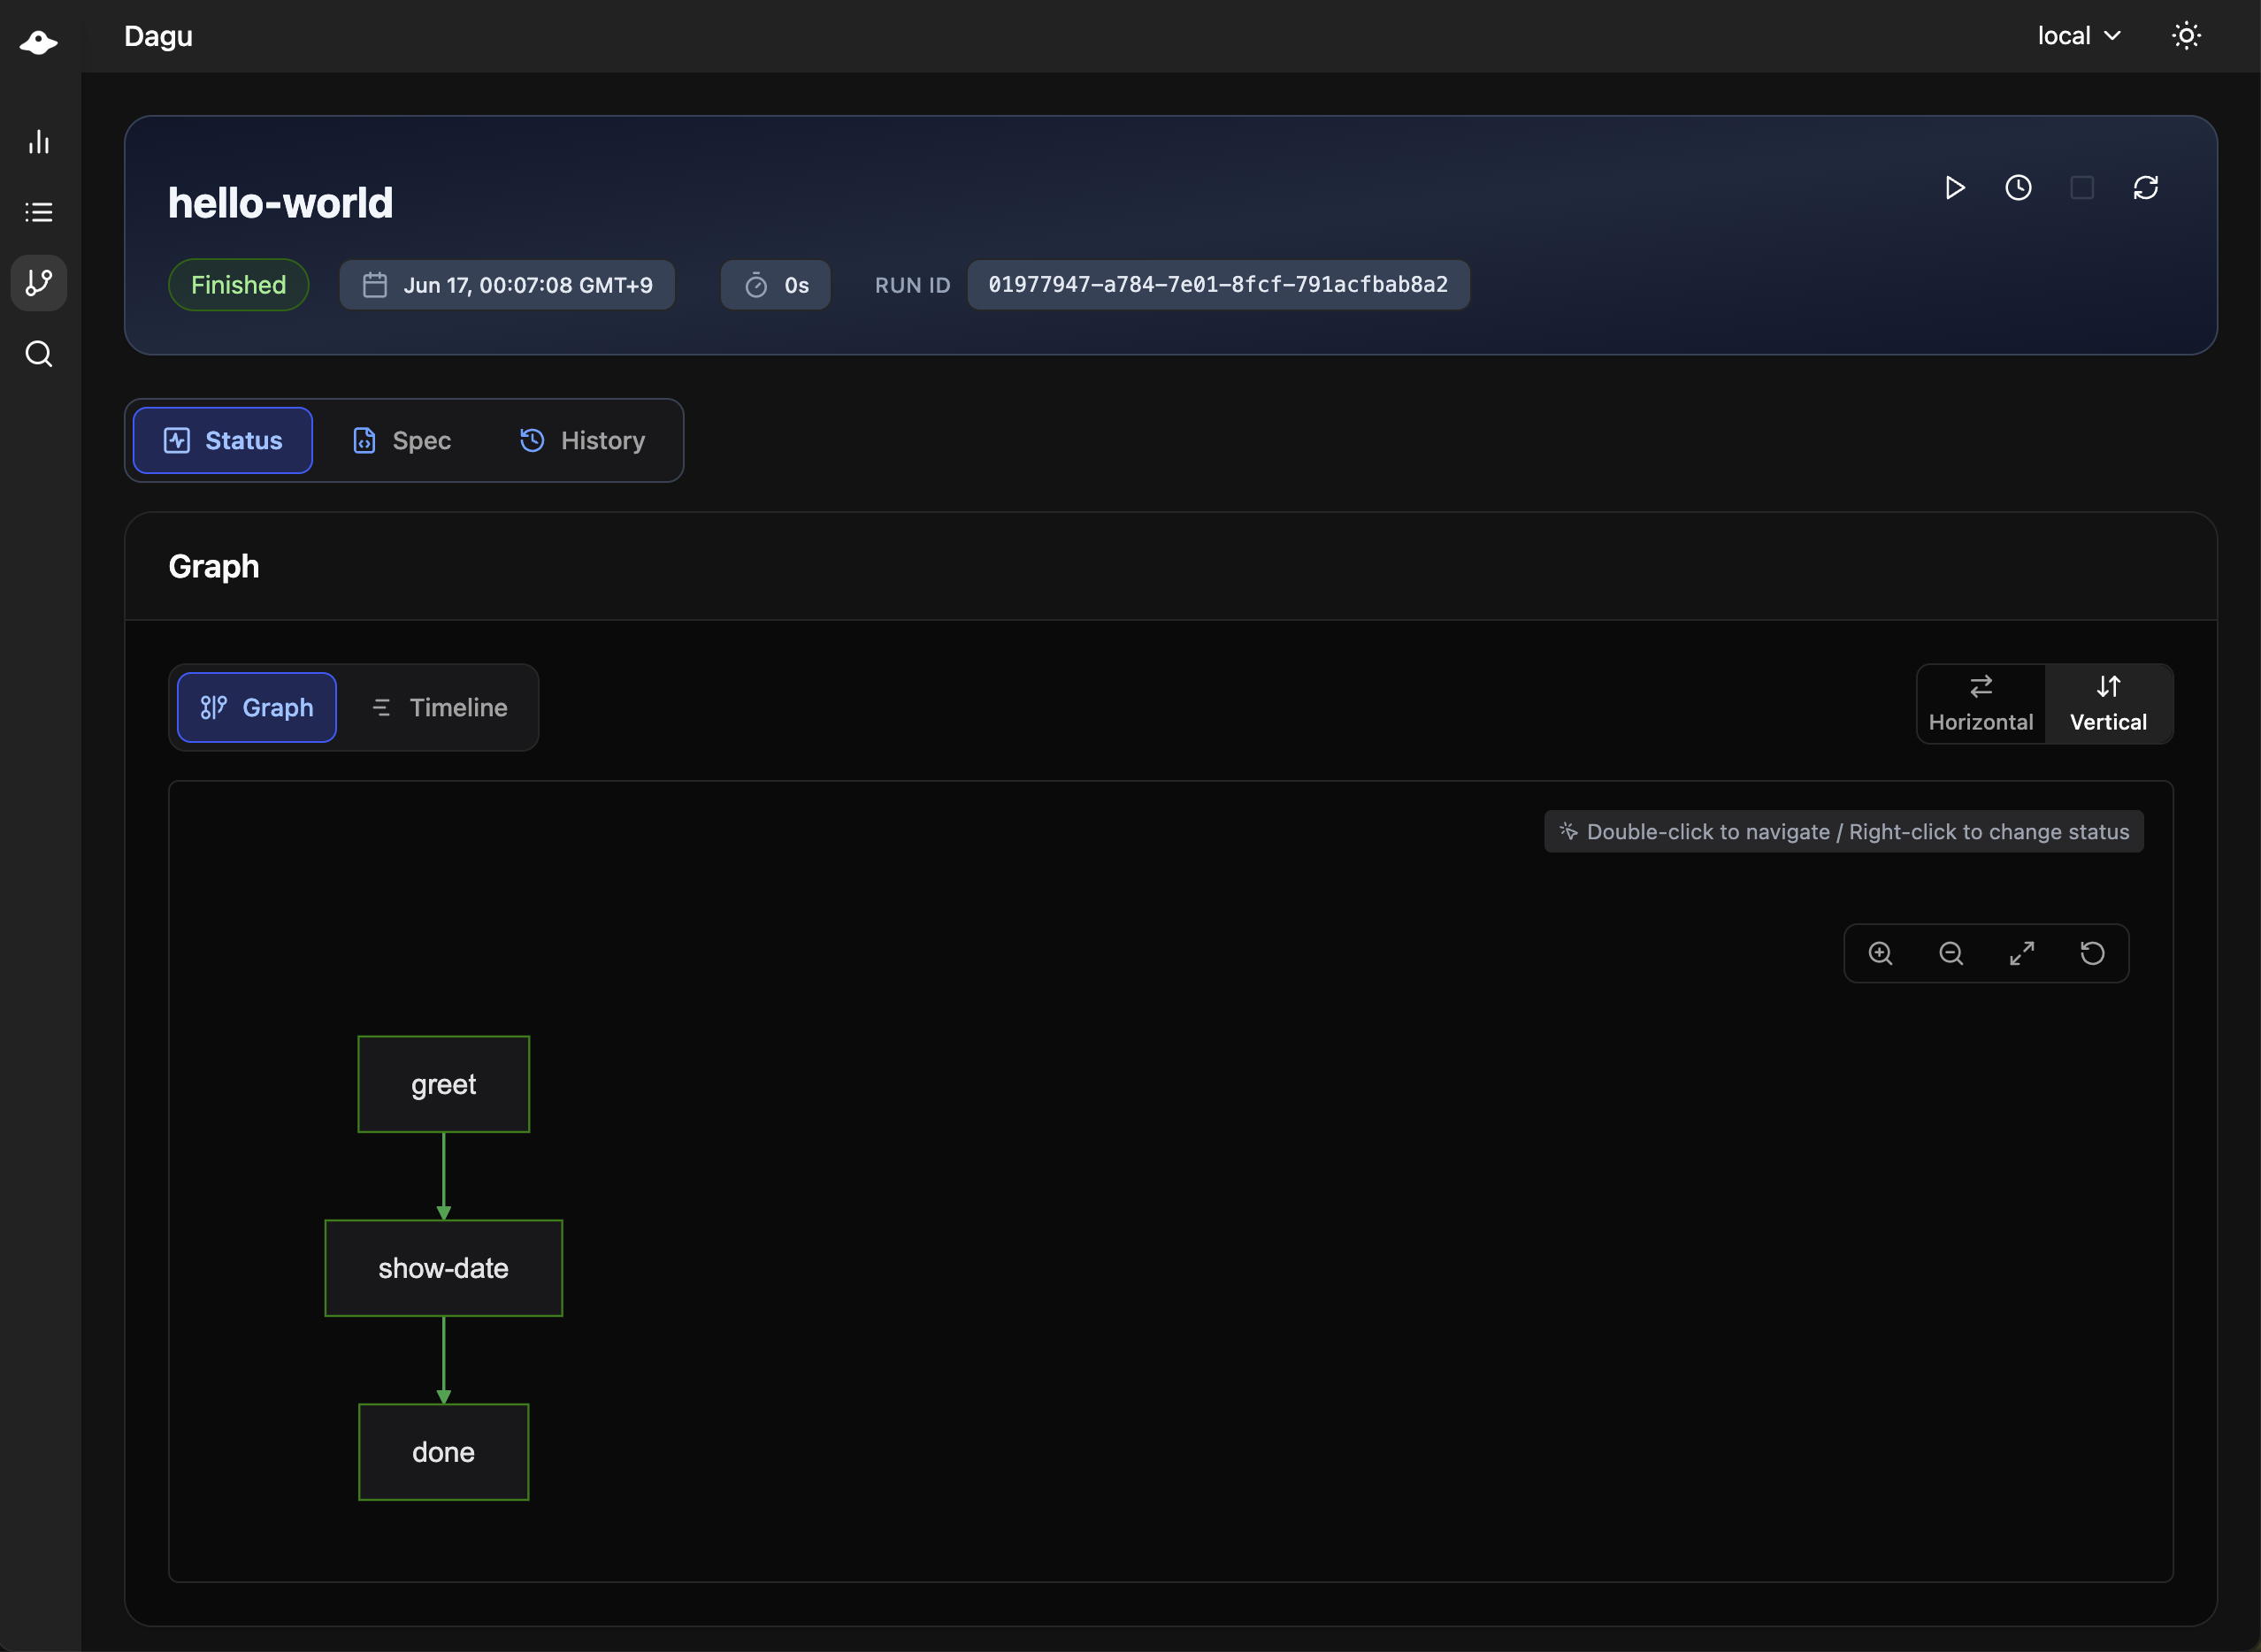
From this page you can usually:
- start, stop, or retry runs
- review the latest graph or timeline
- inspect step-level status
- inspect queued runtime conditions when the latest run is still waiting in a queue
- move between Latest Run, Spec, Webhook, Notifications, and History
Queued runtime conditions are shown only for queued DAG runs and explain the latest observed reason the run has not started yet. See Queued Runtime Conditions for the exact condition fields and reason names.
Notifications
The Notifications section manages team messages from the Web UI.
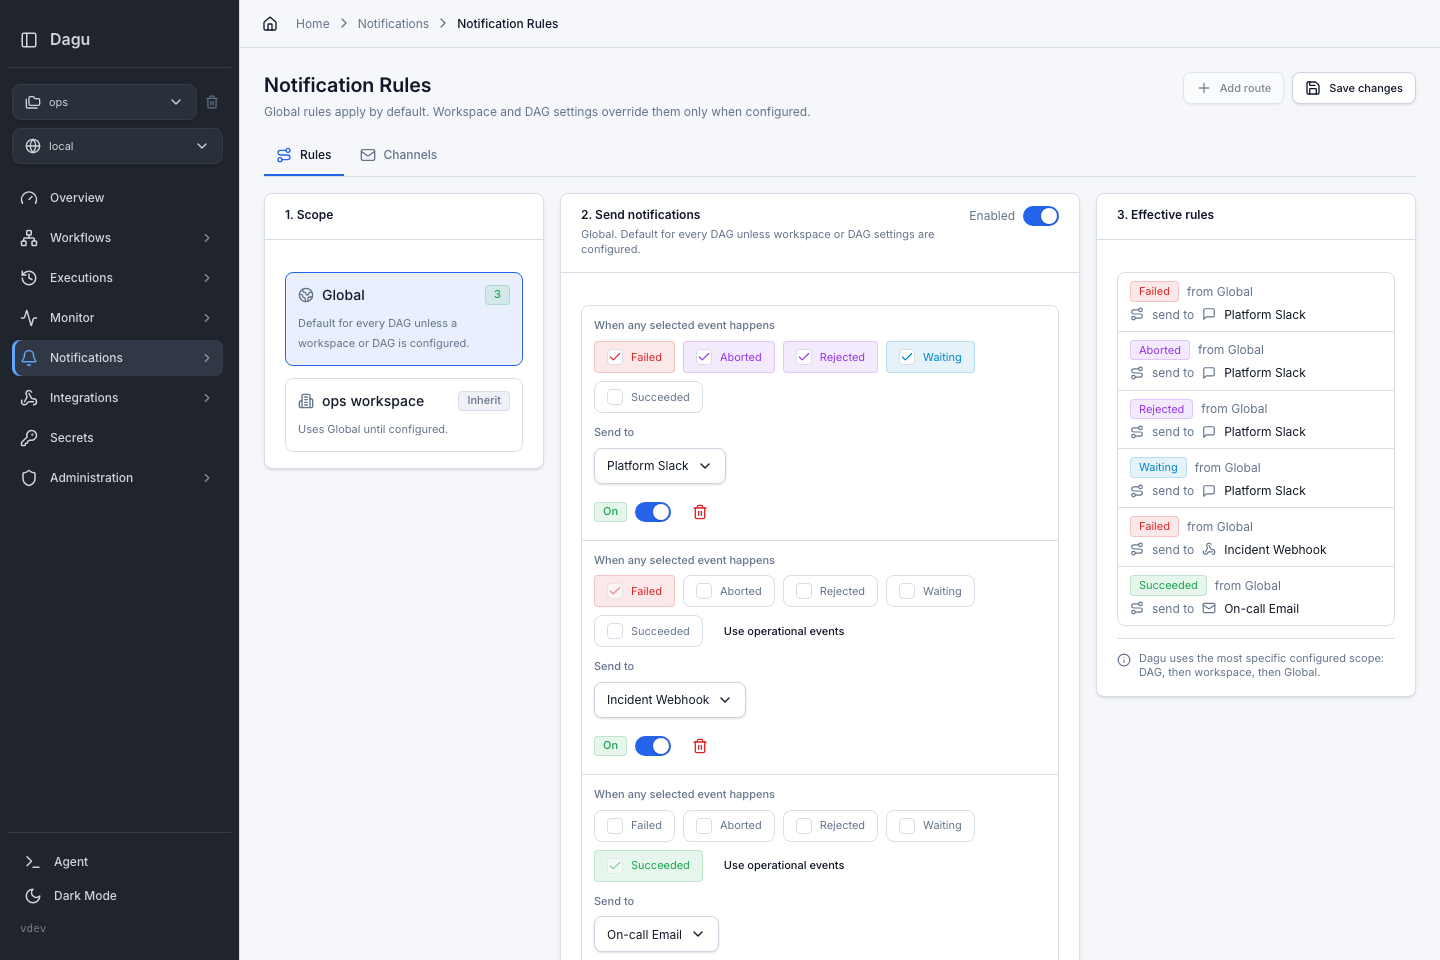
Use it to:
- create reusable Slack, email, Telegram, and webhook channels
- set Global notification defaults for all DAGs
- override Global rules for one workspace
- configure per-DAG exceptions from the DAG detail page
- test channels before relying on them in production
See Notifications for the full routing model.
Incidents
The Incidents section manages provider incidents for production workflow failures.
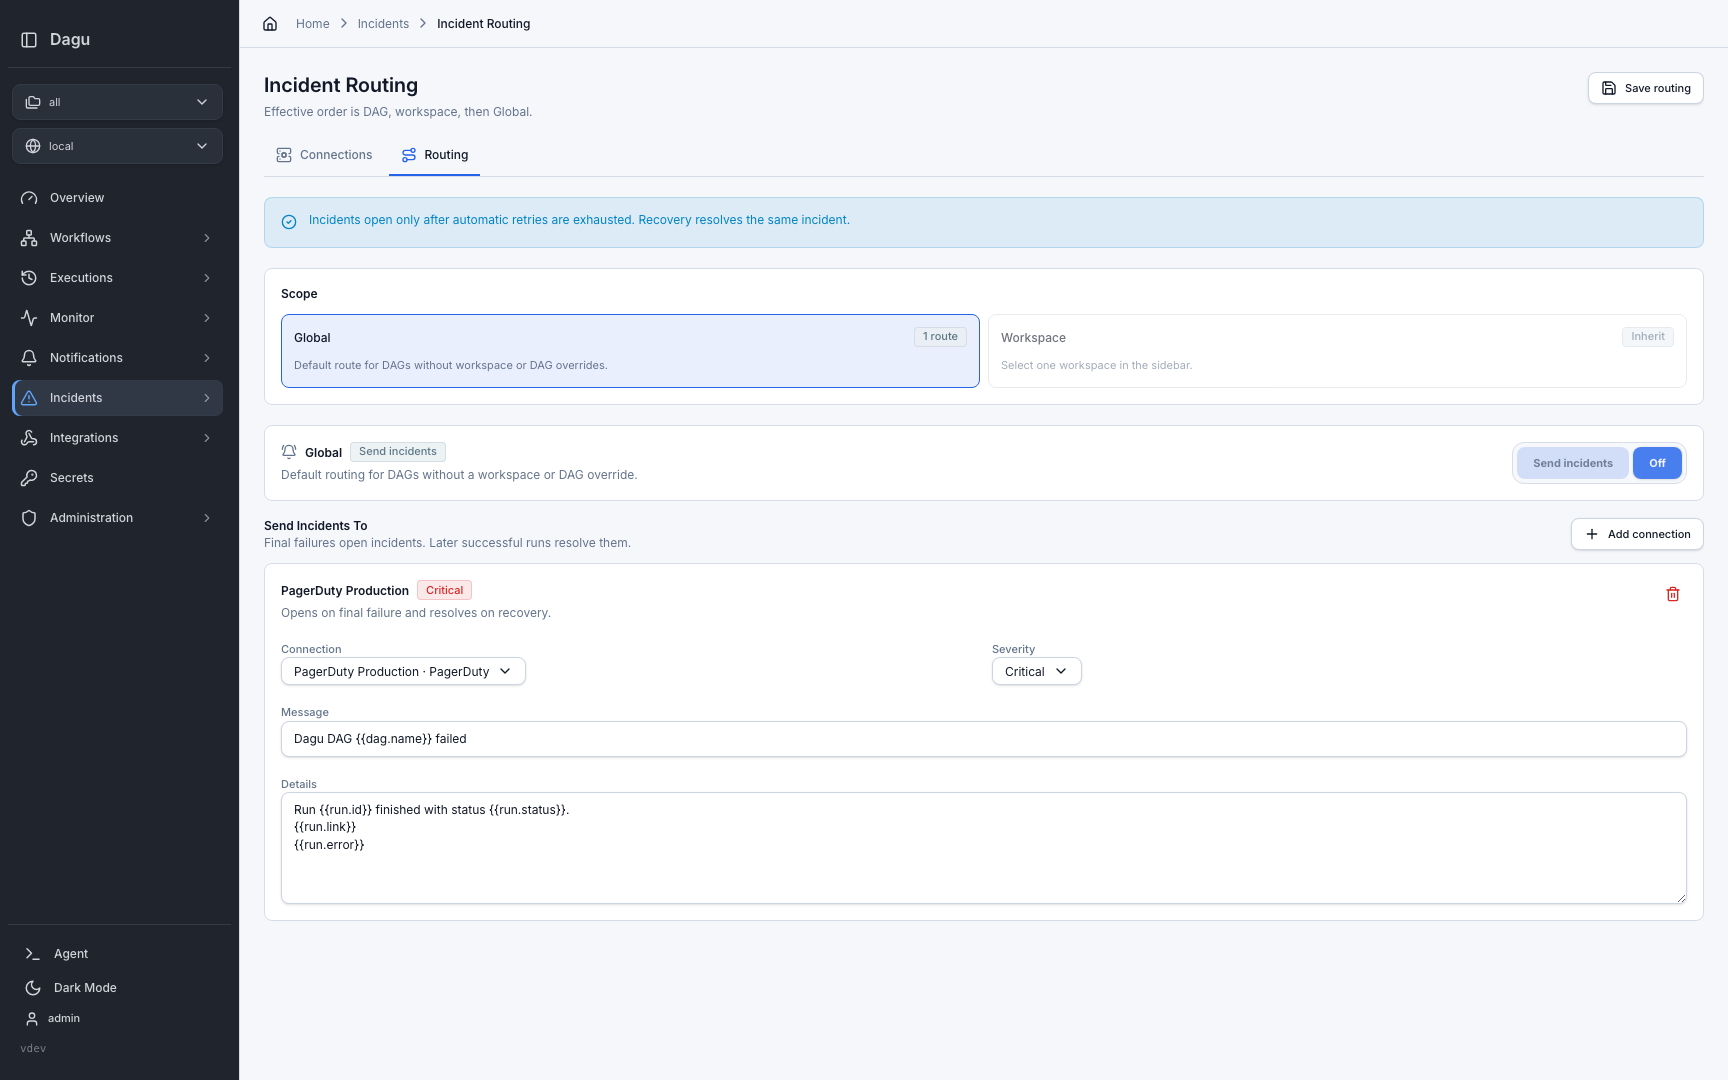
Use it to:
- create reusable PagerDuty and SolarWinds Incident Response connections
- set a Global incident route for every DAG
- override the Global route for one workspace
- configure per-DAG exceptions from the DAG detail page
- test provider credentials before relying on them in production
Incident routing opens incidents only after automatic retries are exhausted, deduplicates repeated failures for the same provider, workspace, and DAG, and resolves the same incident when a later run succeeds.
Incident connections and routing require an active Dagu license or trial on self-hosted deployments. See Incident Routing for the full model.
Run Details
When you open a specific run, Dagu shows the full execution view.
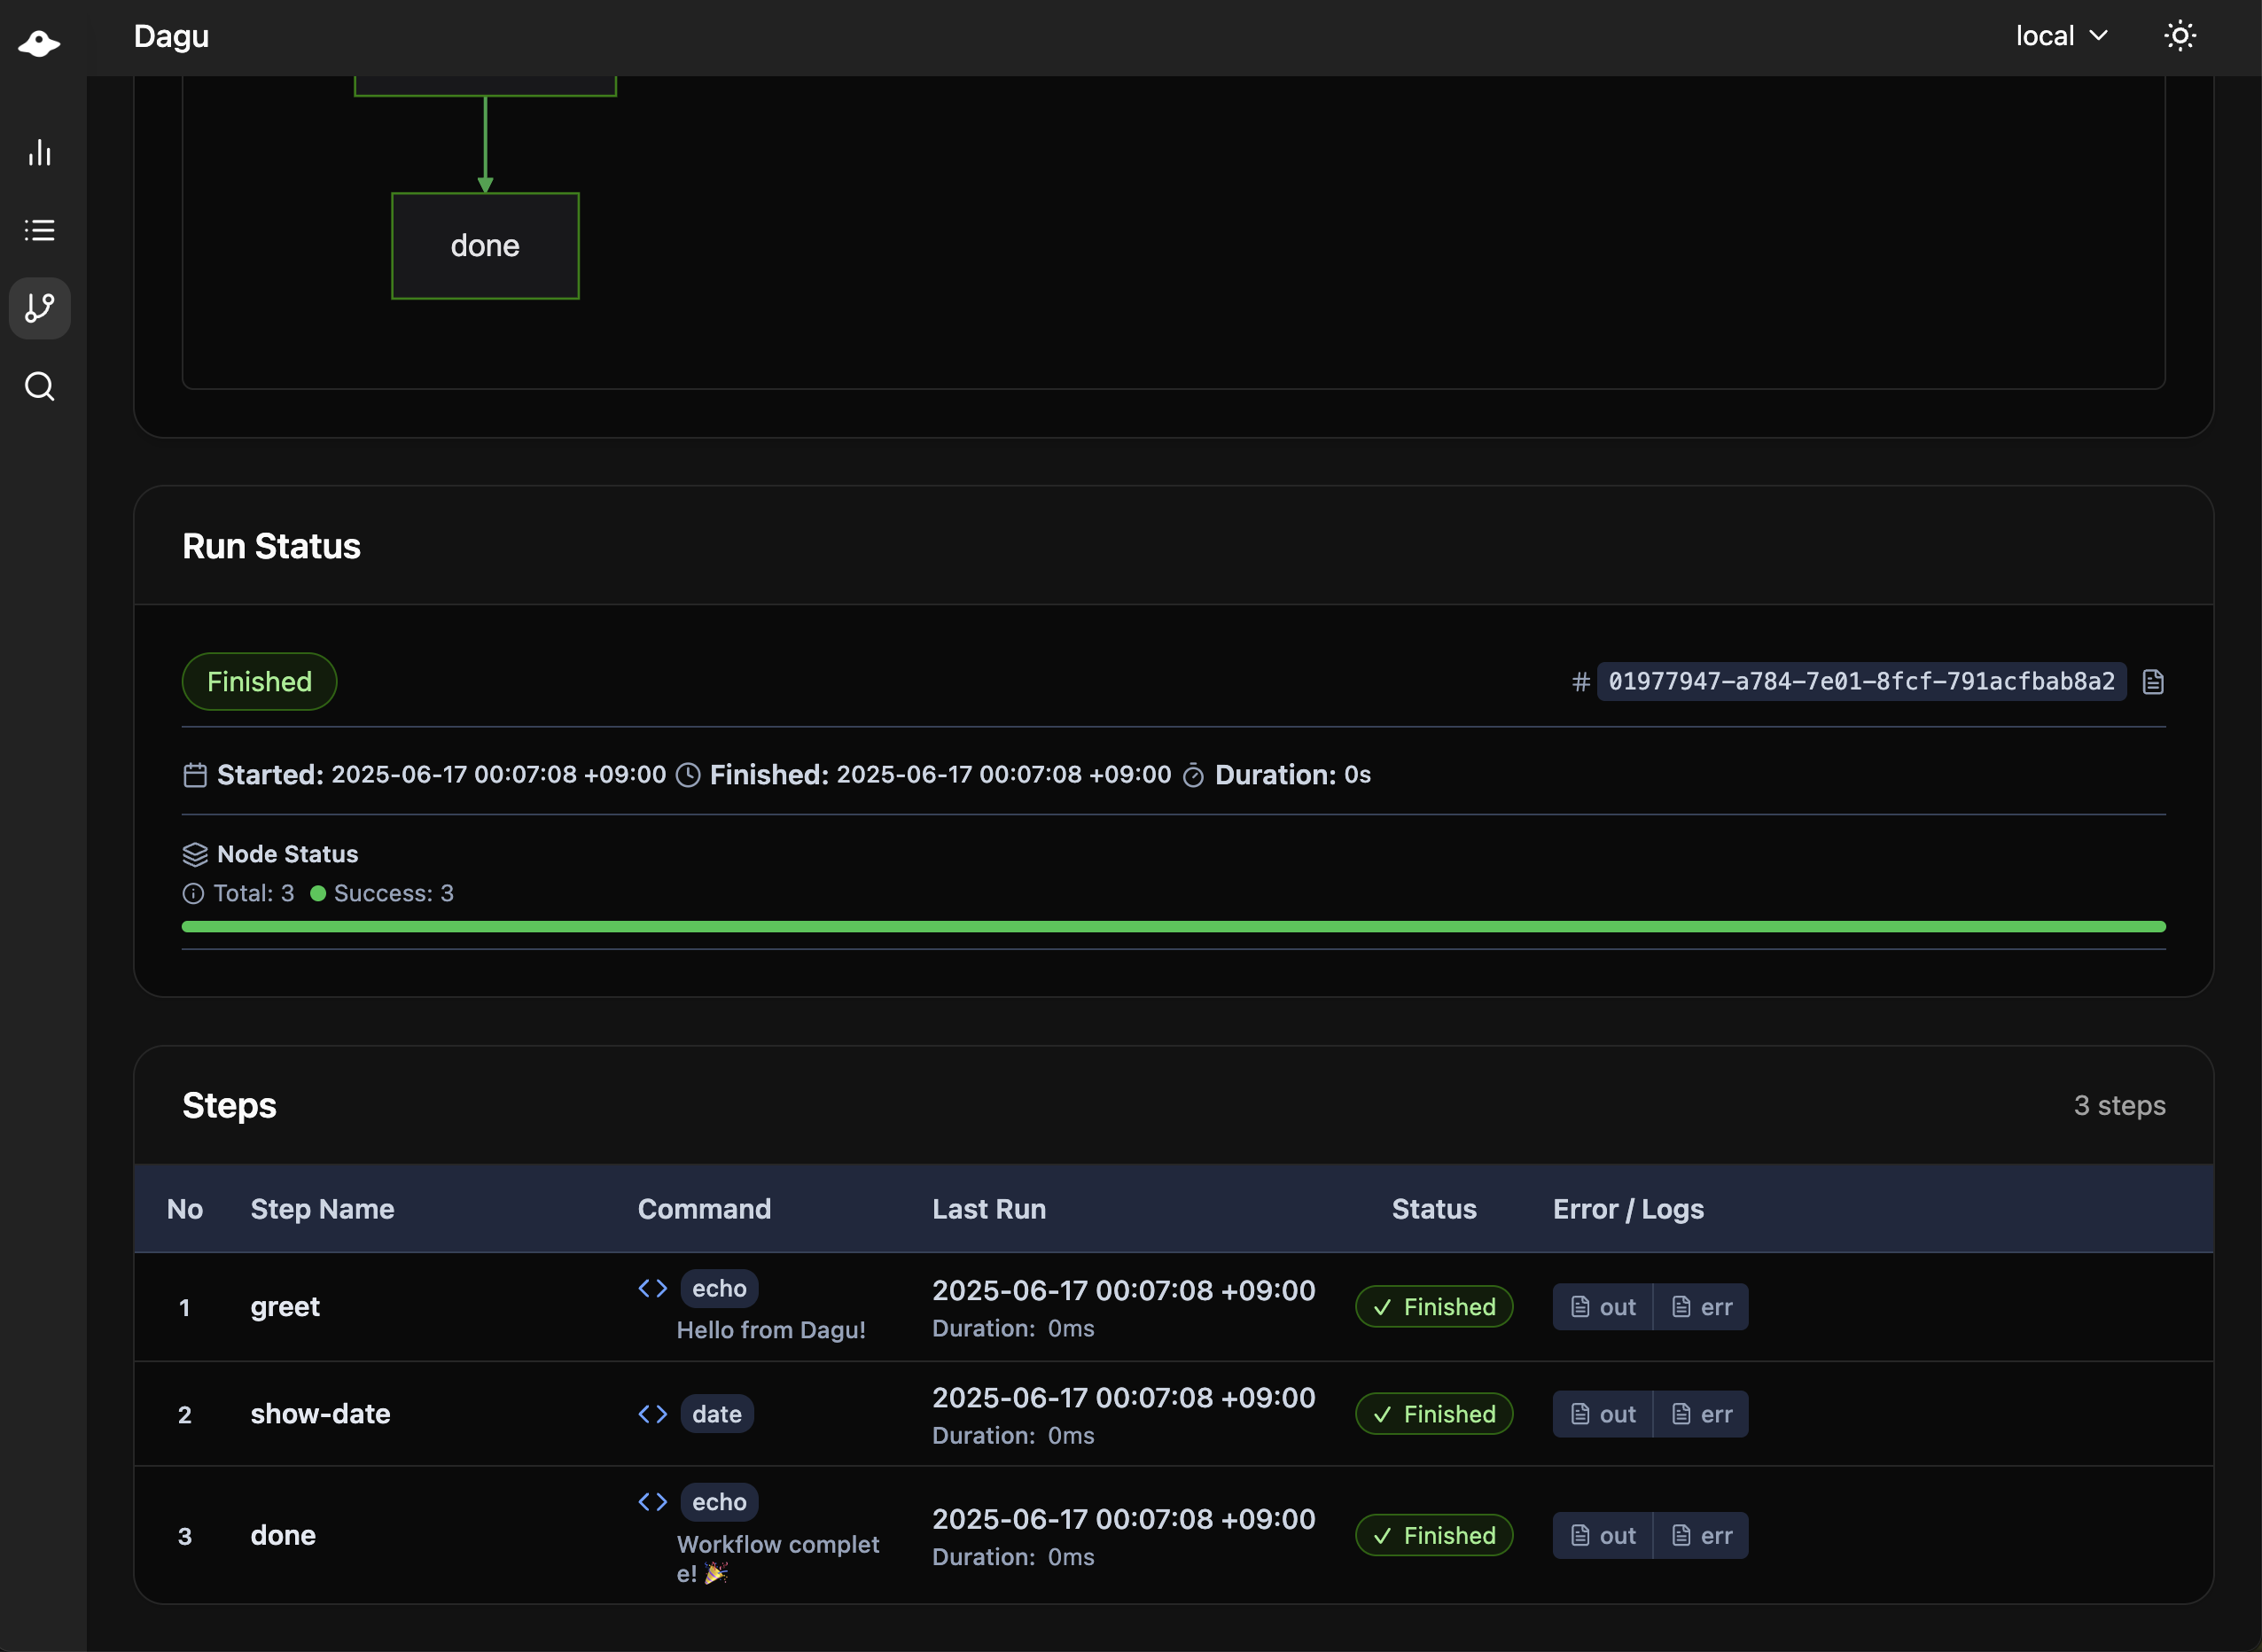
This is where you troubleshoot and verify results:
- Status for the graph and step table
- Timeline for execution ordering and duration
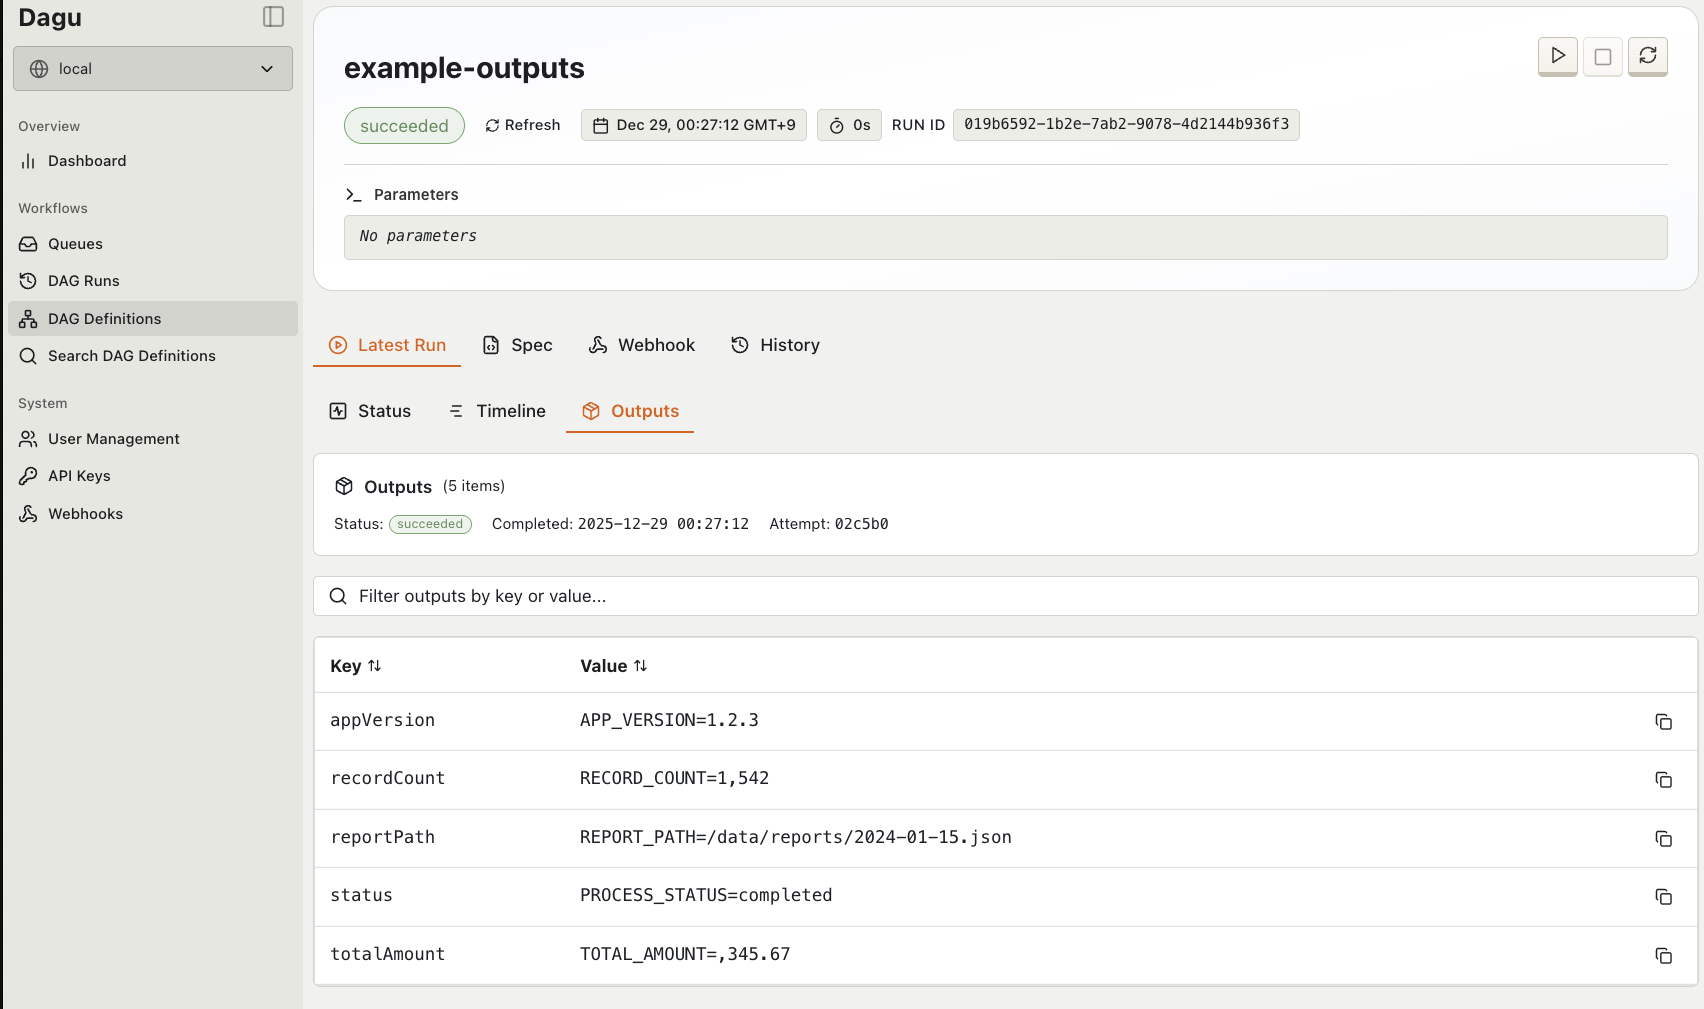
- Outputs for collected output values
- Artifacts for generated files
- Logs for the run and each step
The dedicated outputs view is also available inside the run screen:
The same run details screen also includes an Artifacts tab for generated files. Markdown, text, and image artifacts can be previewed inline without leaving the page, and files can be downloaded from the tab:
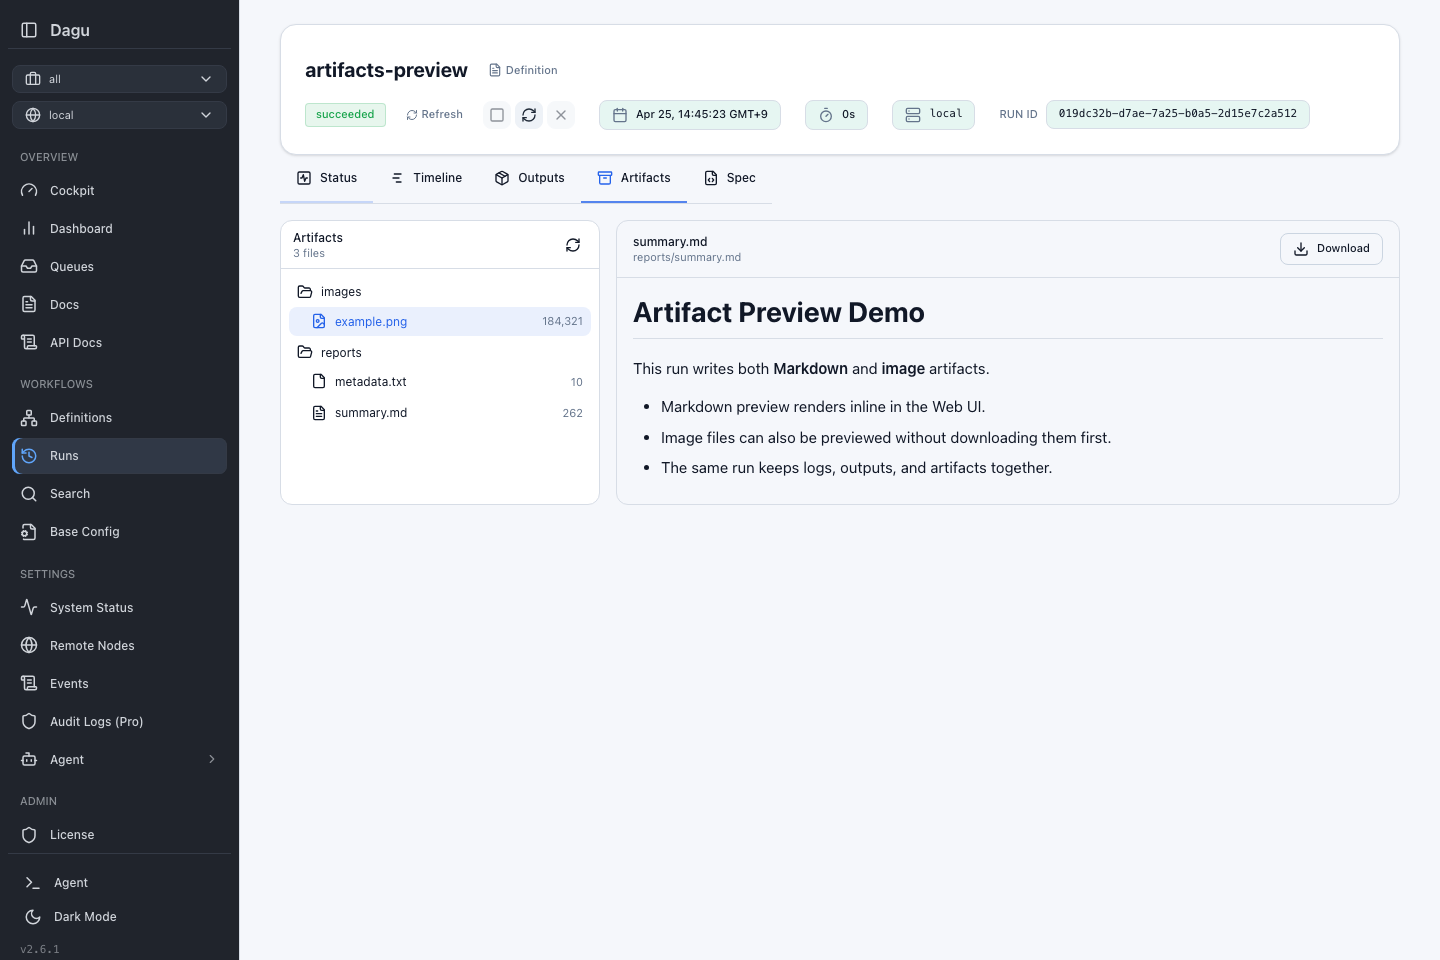
See Artifacts for configuration, storage, and API details.
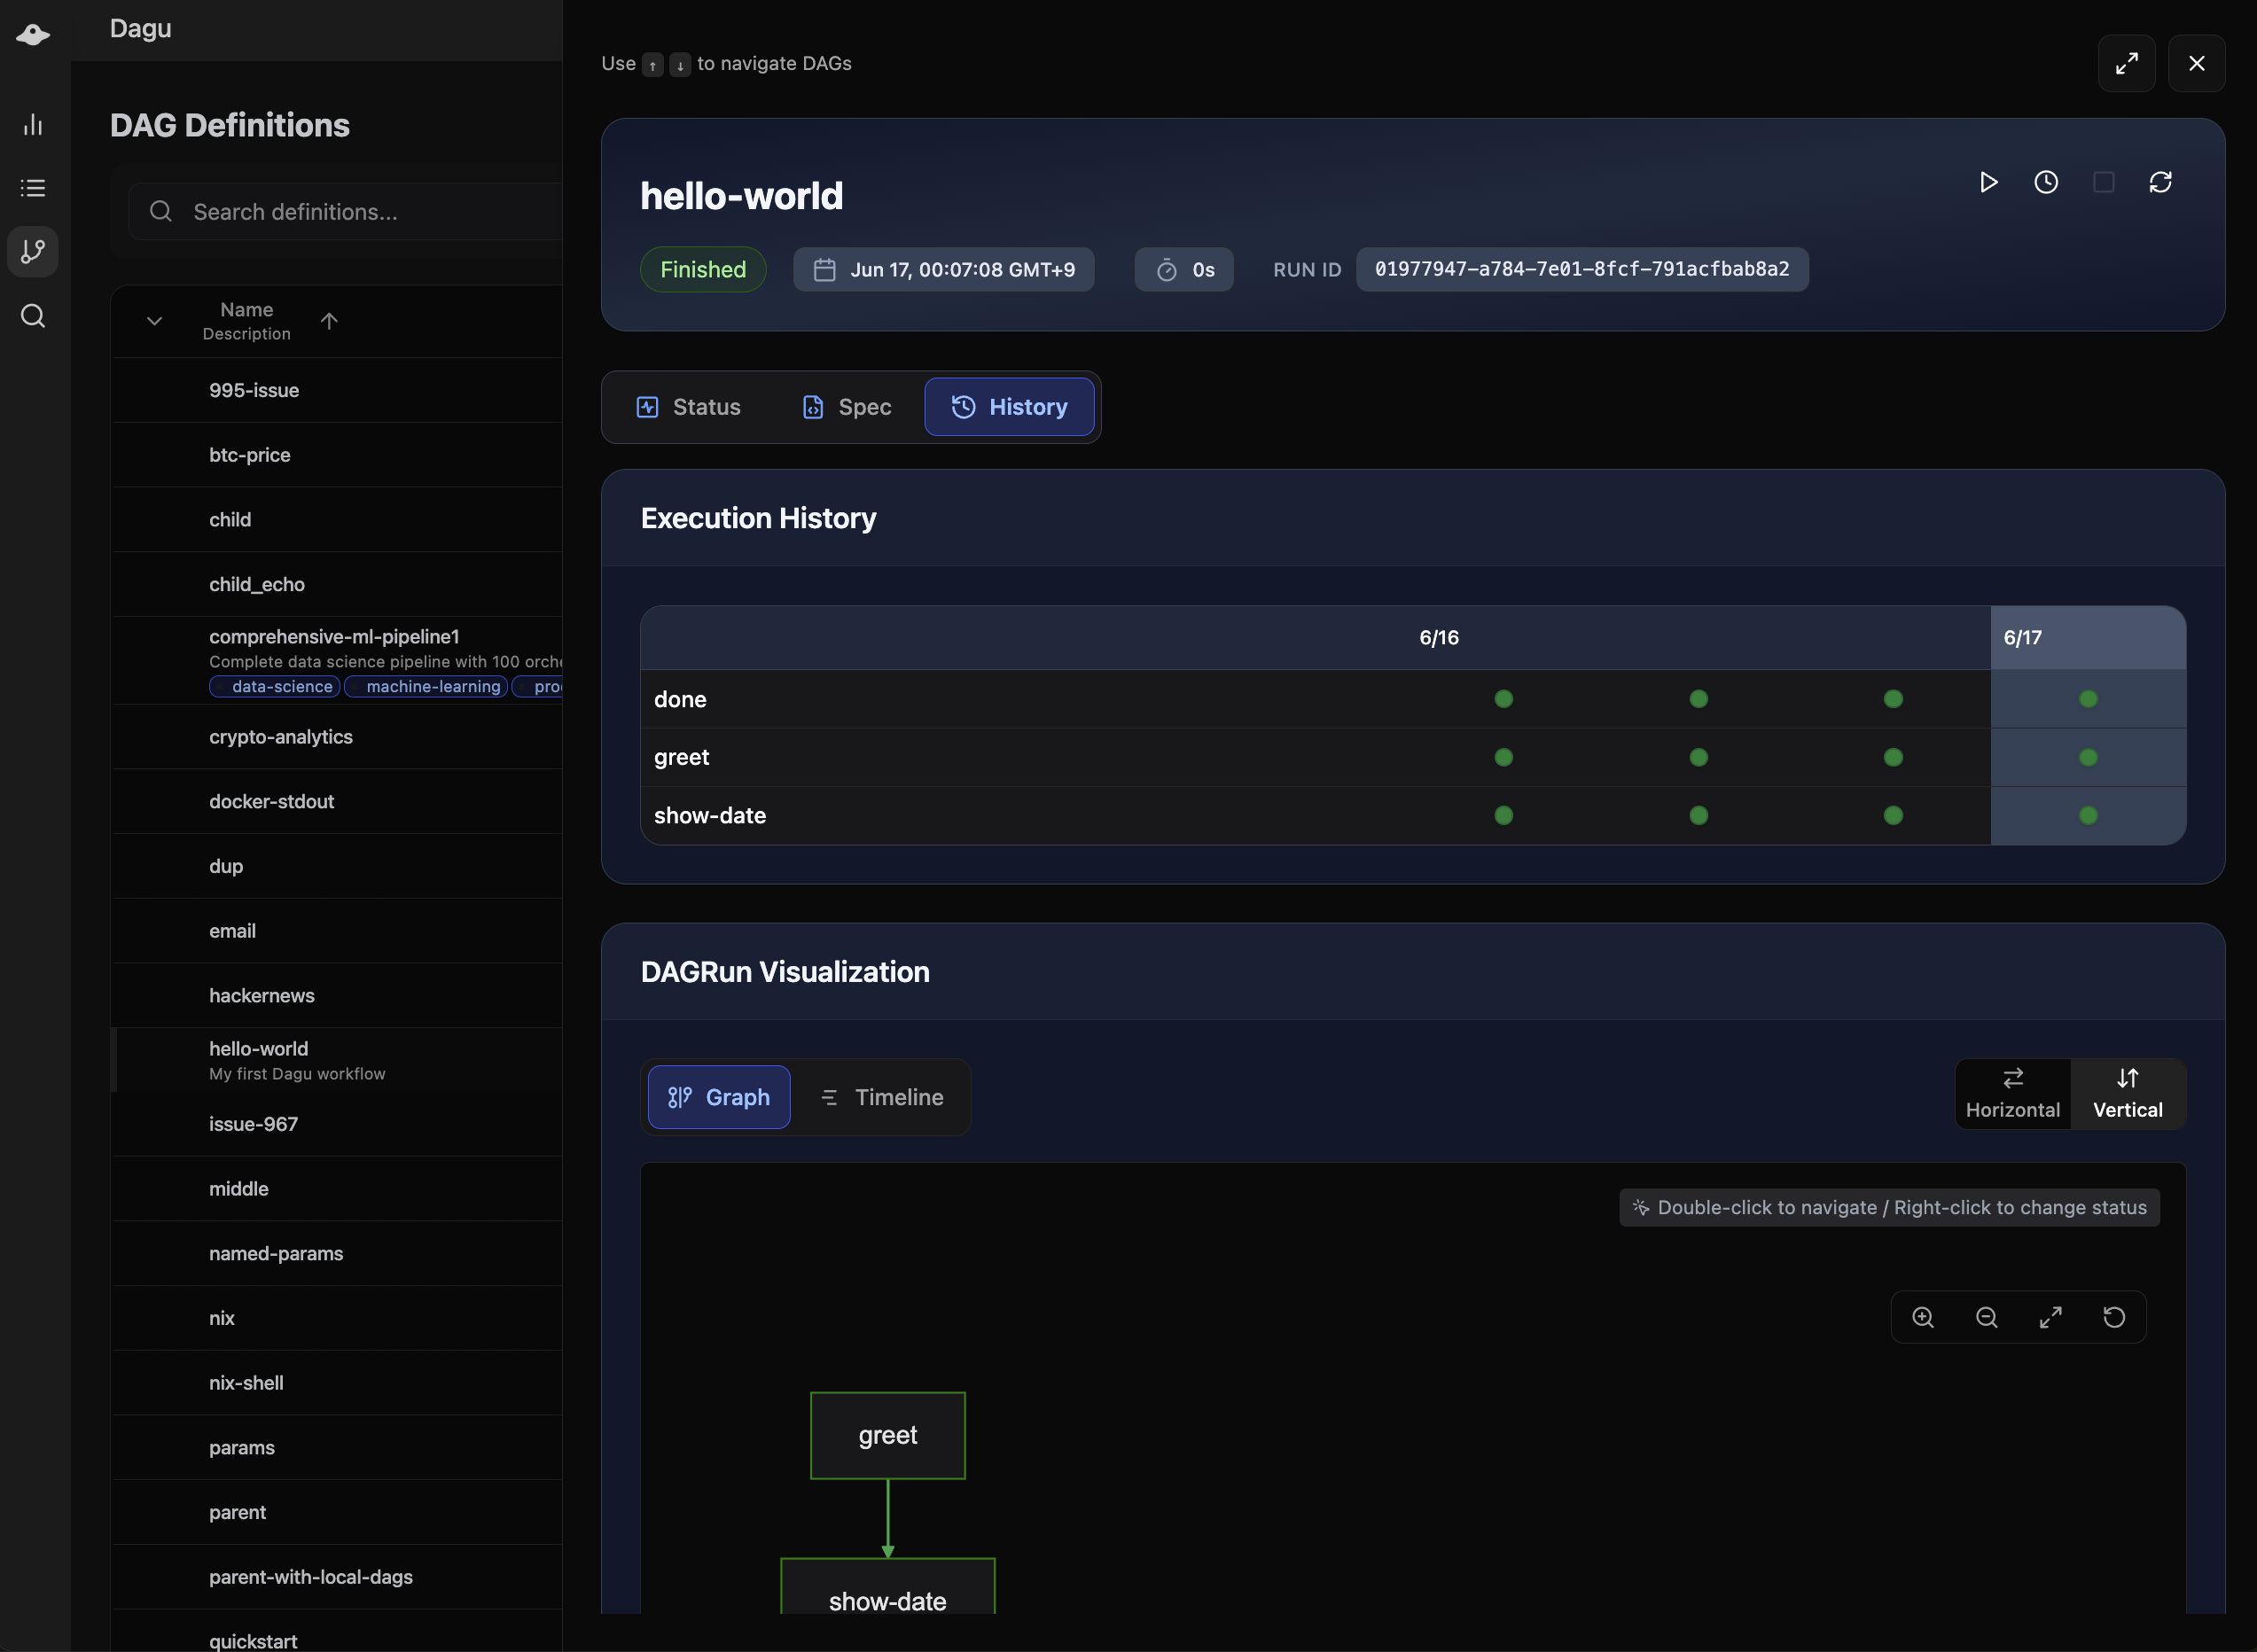
Run History And Logs
Use workflow history when you want to compare multiple attempts of the same DAG:
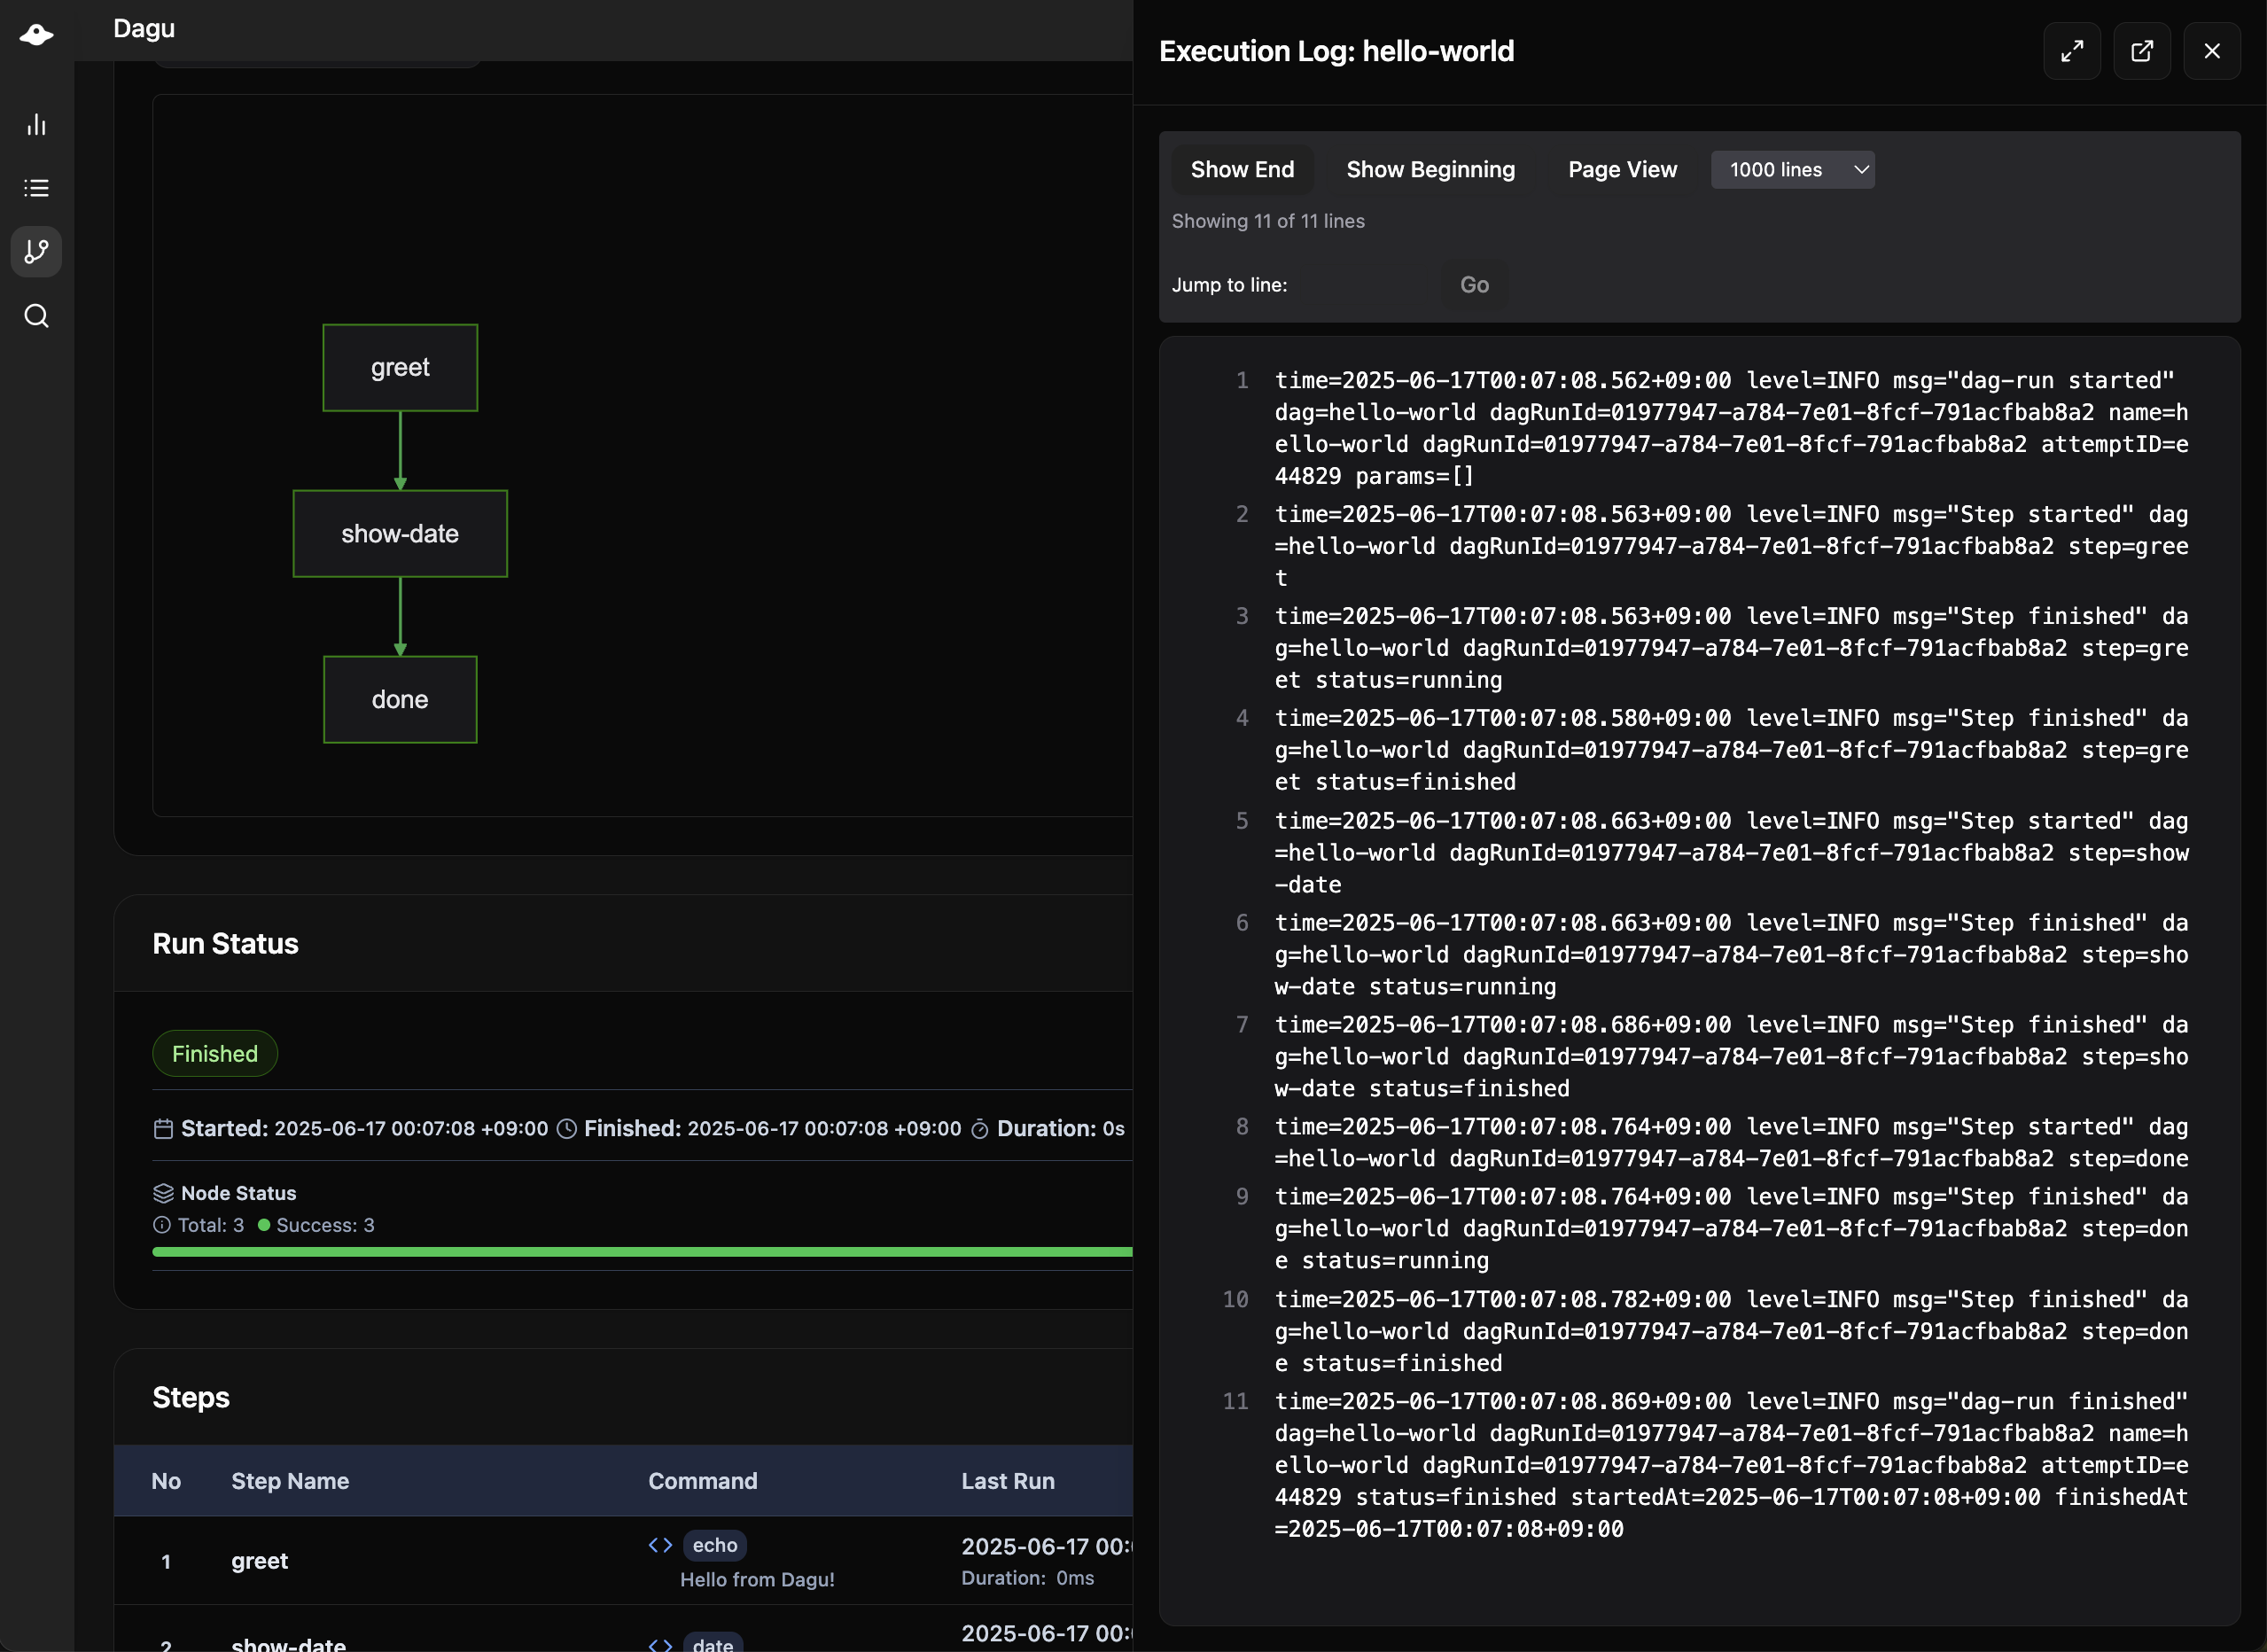
Use the log view when you want the detailed text output for a run or a single step:
DAG Editor
You can edit workflow YAML directly in the browser when your role allows writes.
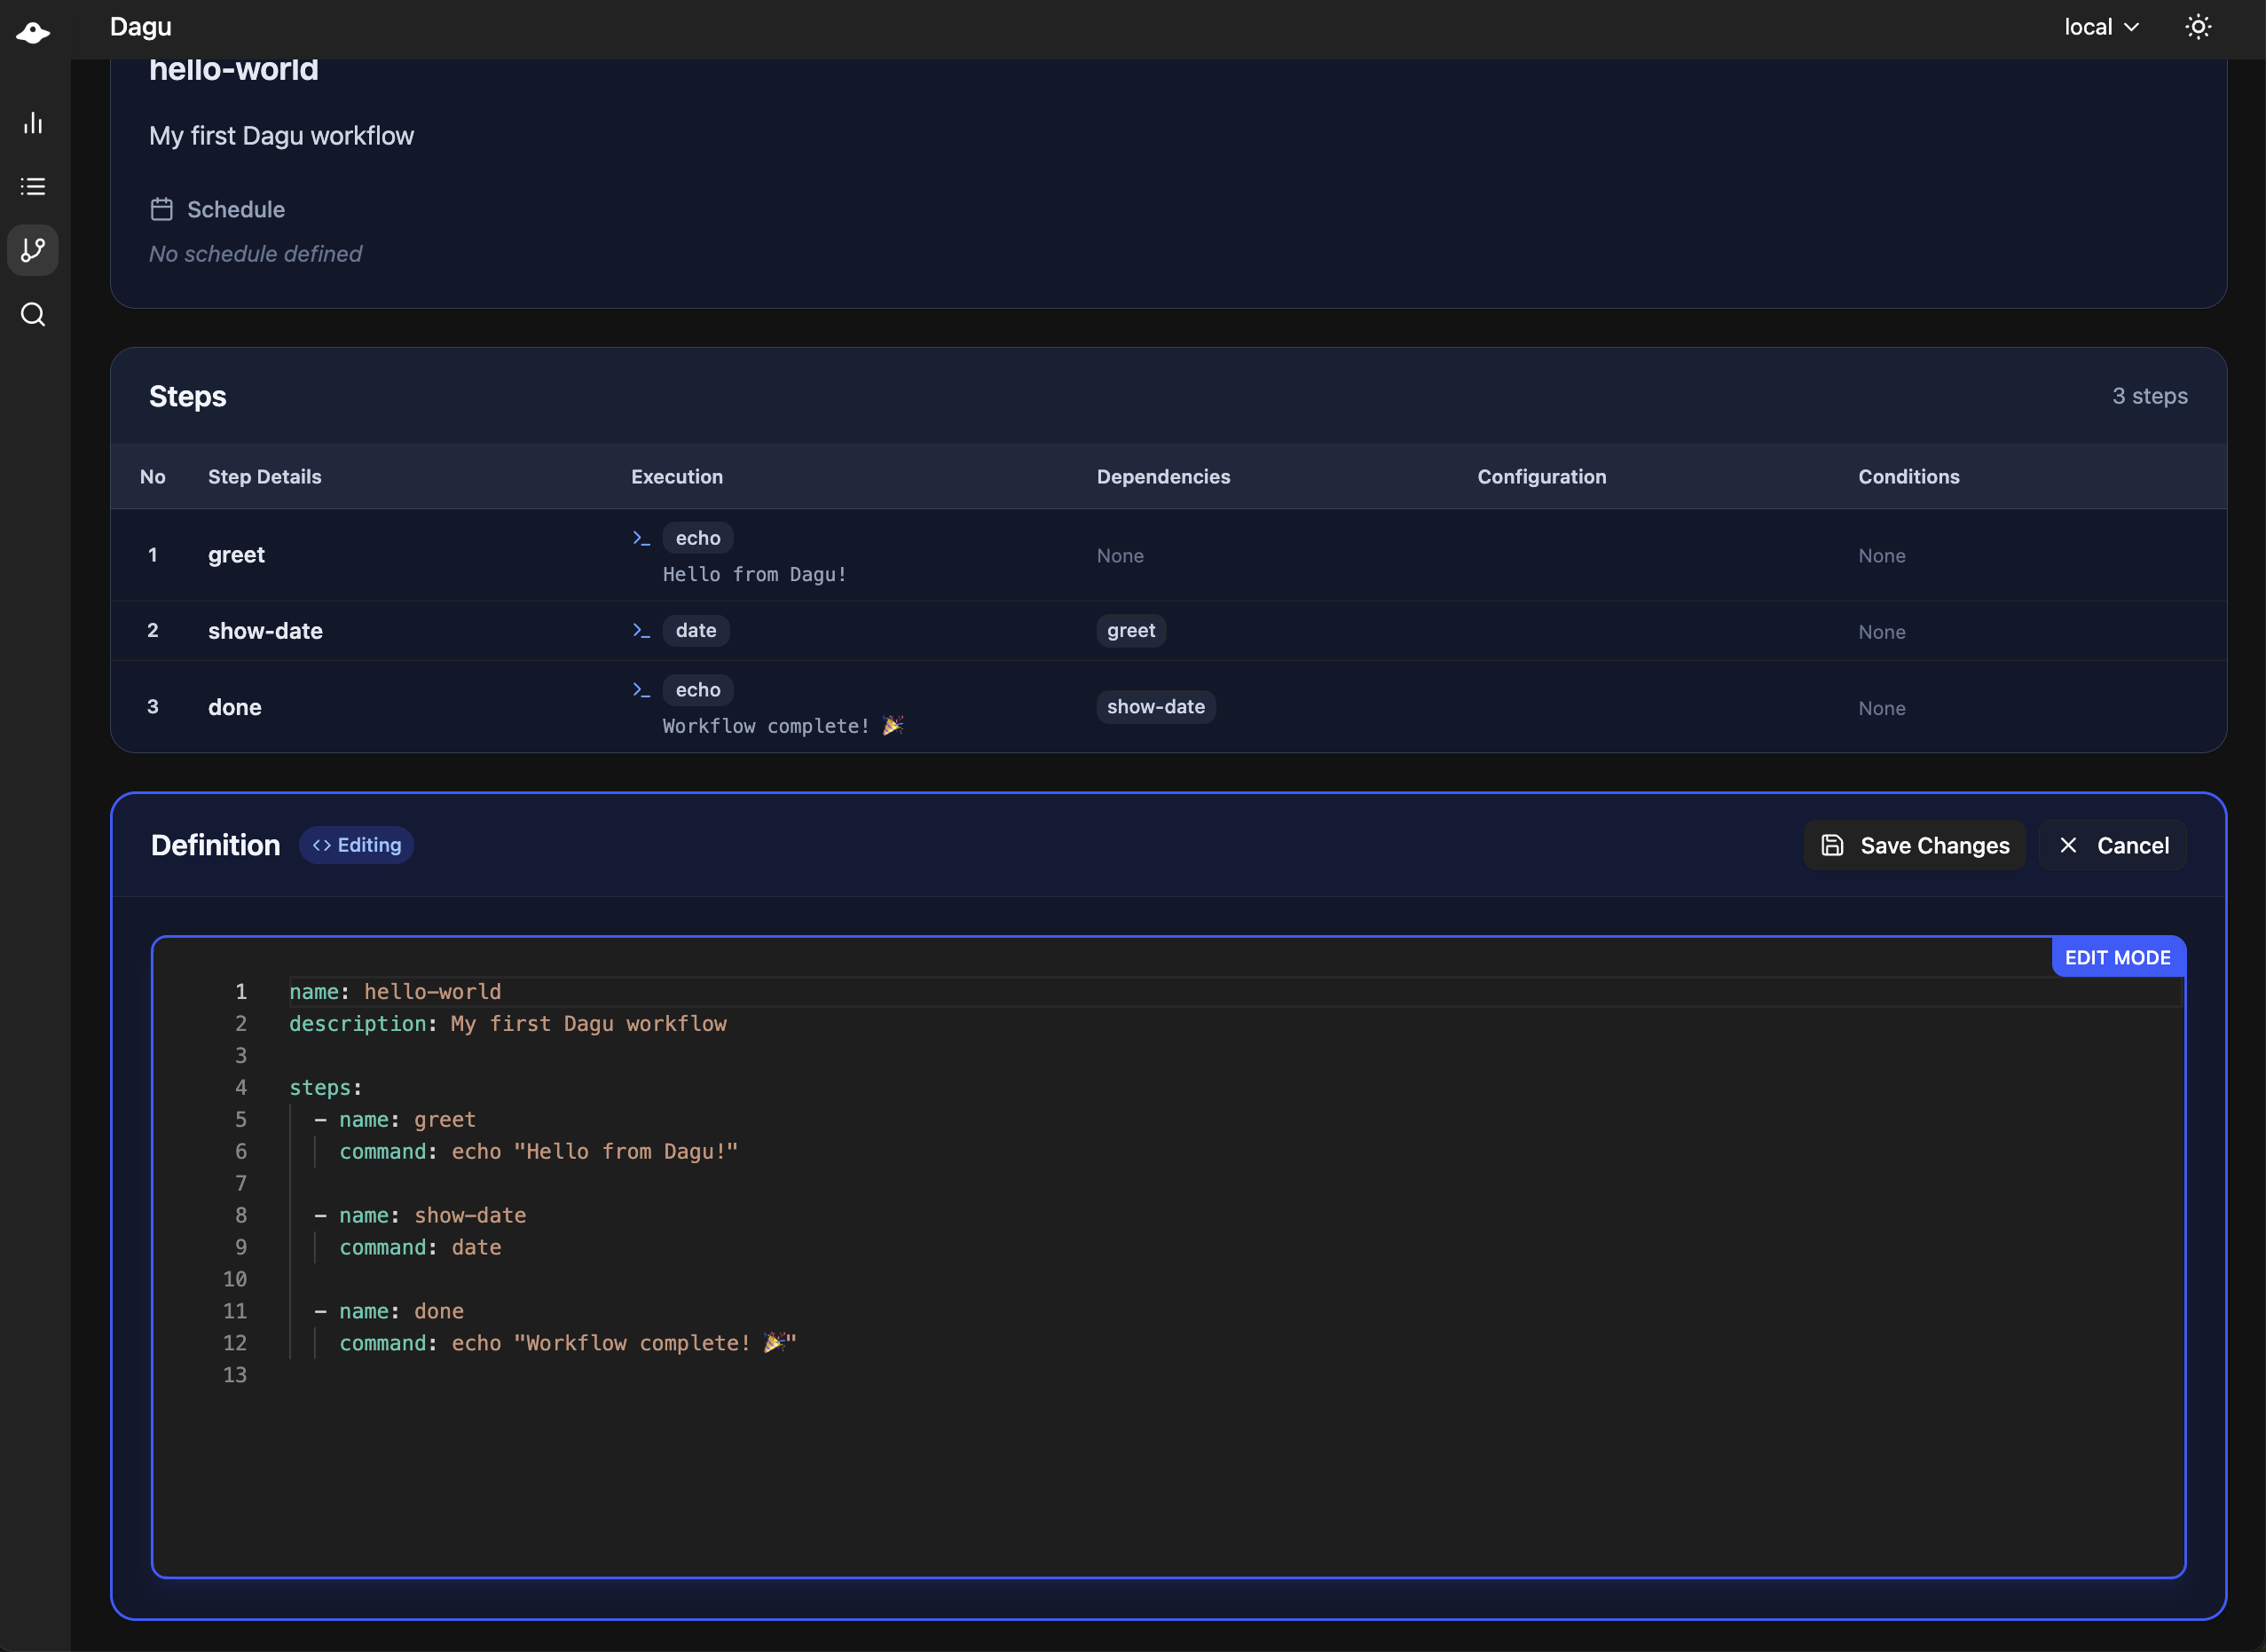
The editor includes:
- YAML editing with validation
- schema-aware help and completion
- save actions tied to normal DAG permissions
Search
Search helps when you know roughly what you need but not exactly where it lives.
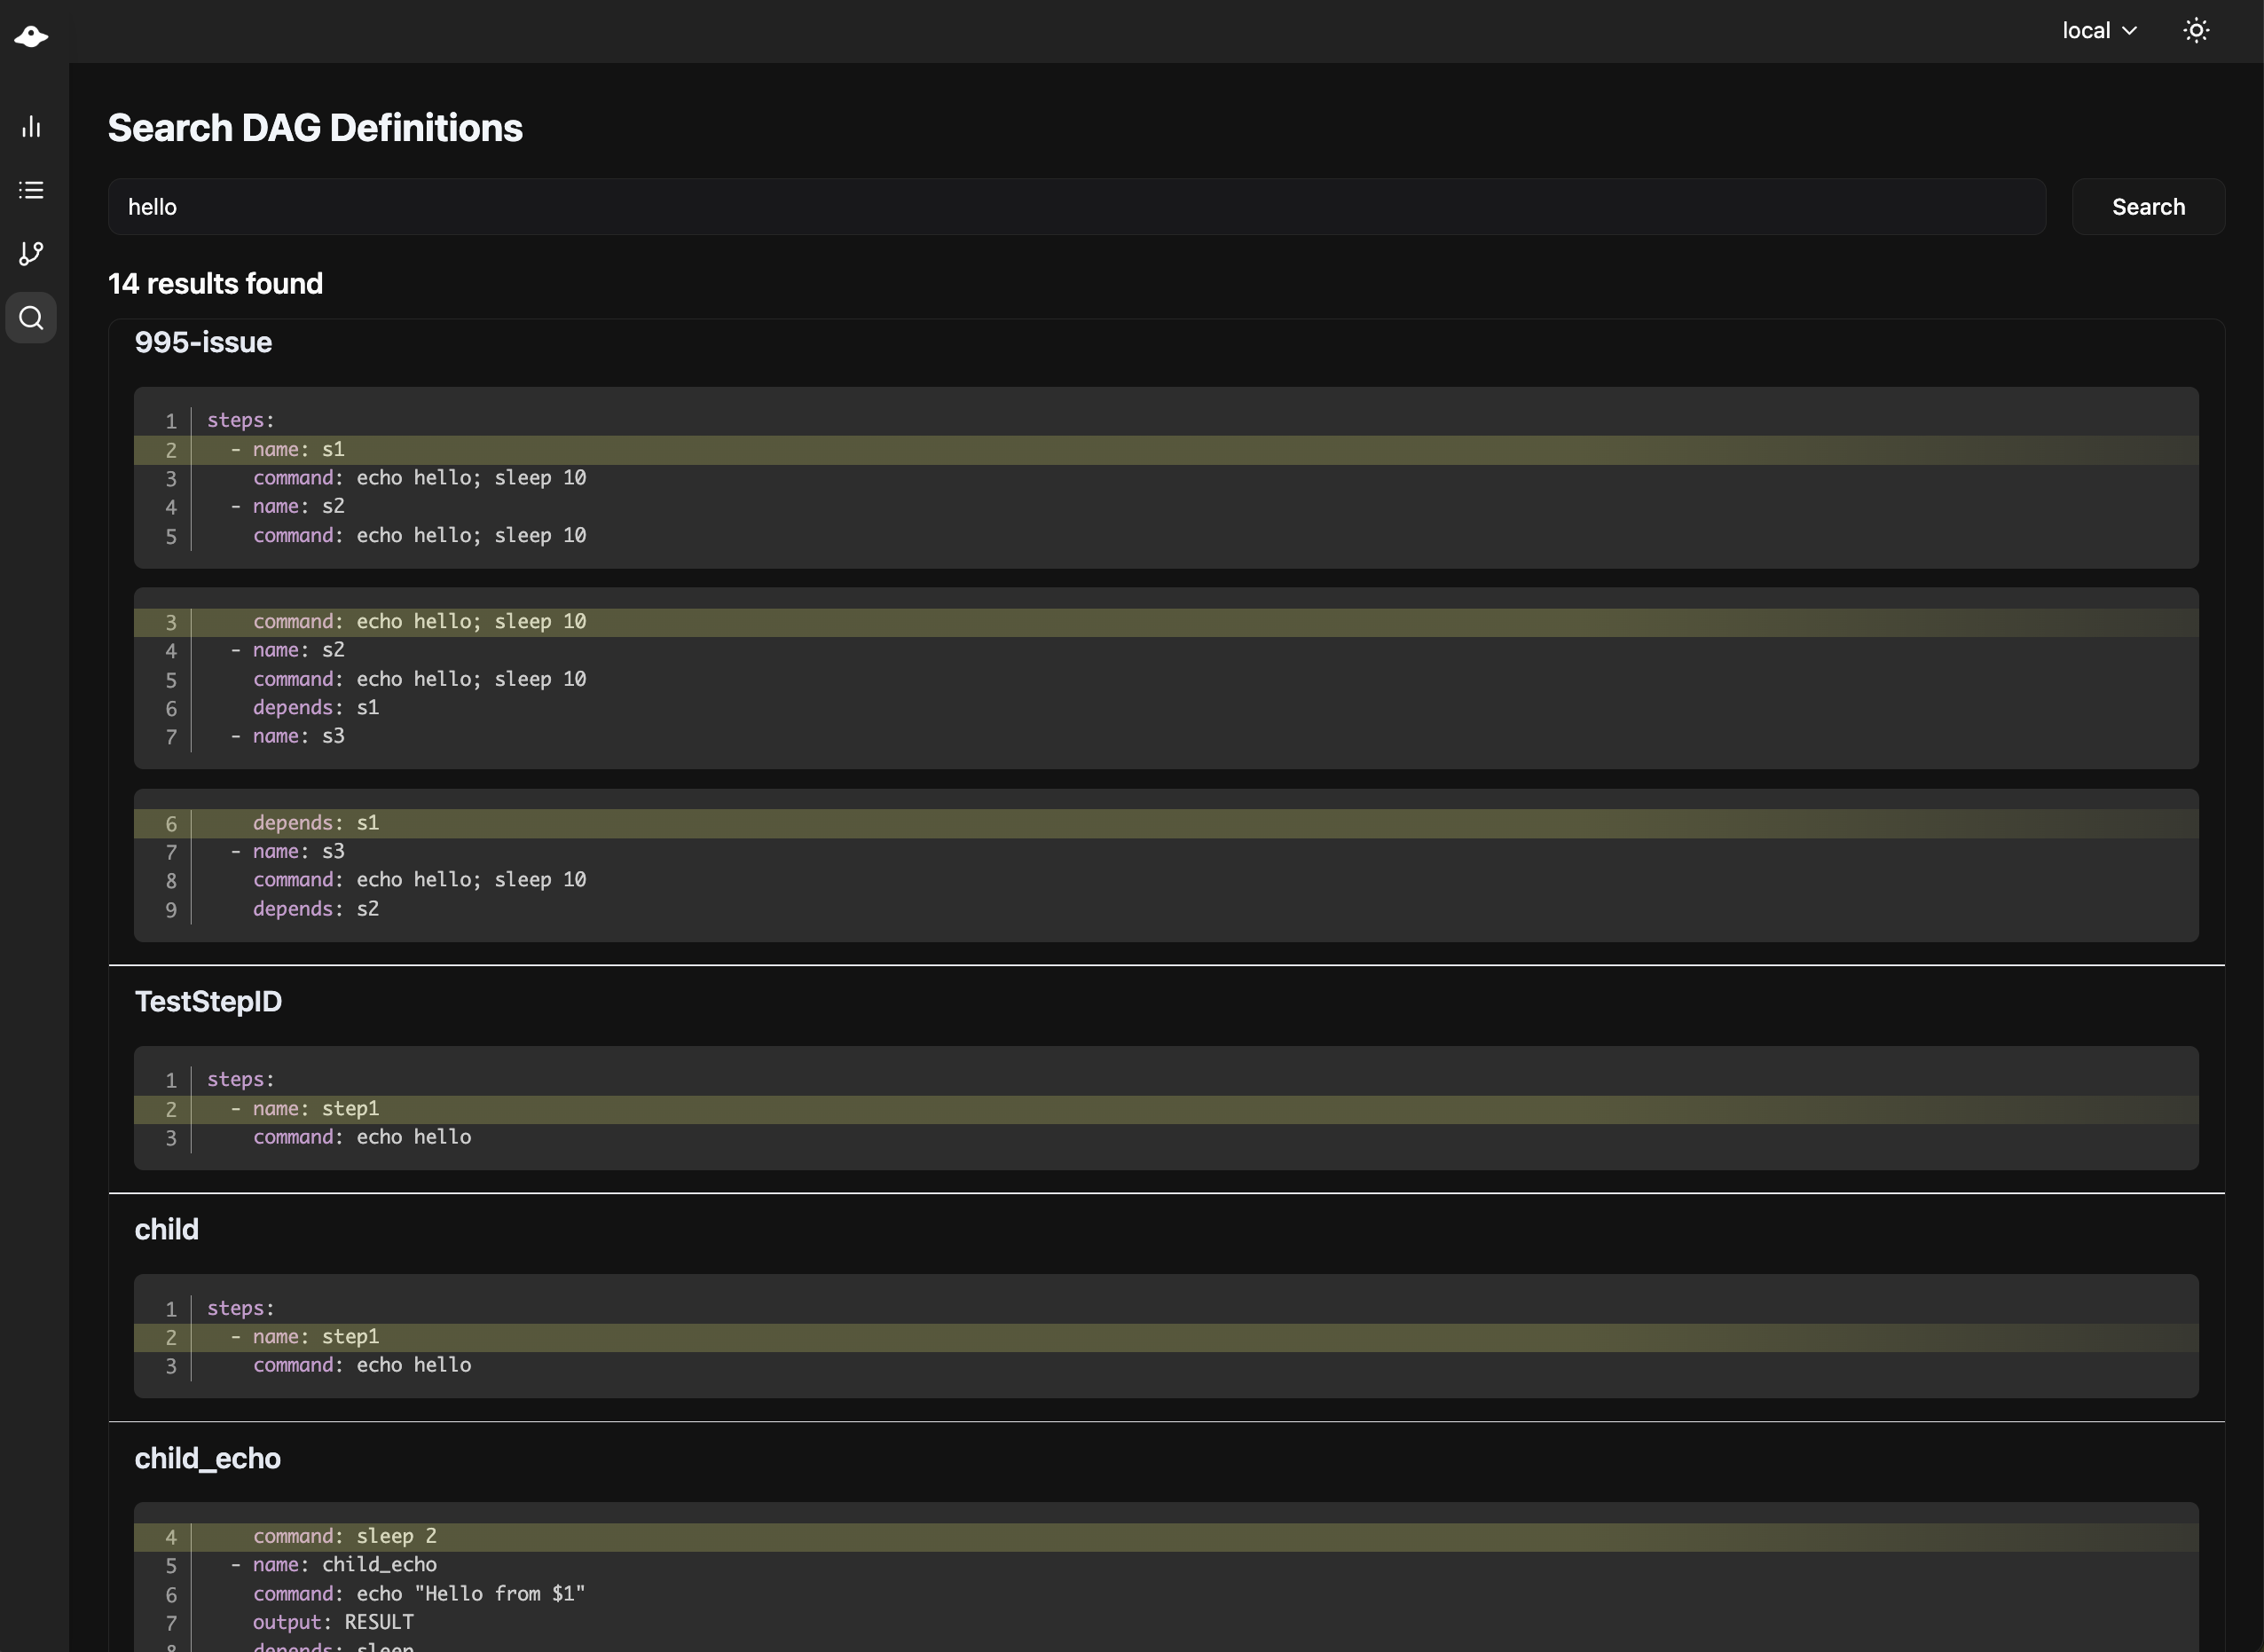
You can search:
- DAGs for workflow definitions
Profiles
The Profiles page manages named runtime profiles for DAG runs. A profile groups non-secret variables and write-only secret values, then makes that group selectable from the start and enqueue dialogs.
Use profiles when the same DAG should run against different environments, such as dev, staging, or prod, without changing the DAG YAML.
Run history and run details show the selected profile name when a profile was used. Retries inherit the original run's profile.
See Profiles for the Web UI workflow and Runtime Profiles for CLI, API, permission, and retry behavior.
Secrets
The standalone Secrets page manages encrypted Dagu-managed secret values for a selected scope. These secrets are referenced directly from DAG YAML with secrets[].ref.
Use it to:
- create a ref such as
prod/db-password - rotate the value without editing DAG YAML
- disable or enable a secret for future runs
- keep the plaintext value out of API responses and workflow files
DAGs reference Web UI-managed secrets with ref:
secrets:
  - name: DB_PASSWORD
ref: prod/db-passwordRegistry refs resolve from the DAG's own scope first, then Global. A DAG in workspace=ops checks ops before global. A DAG without a workspace label uses Global directly.
See Secrets for the Web UI workflow and Workflow Secrets for the YAML reference.
System Status
System Status shows the health of the scheduler, coordinator, and the current machine.
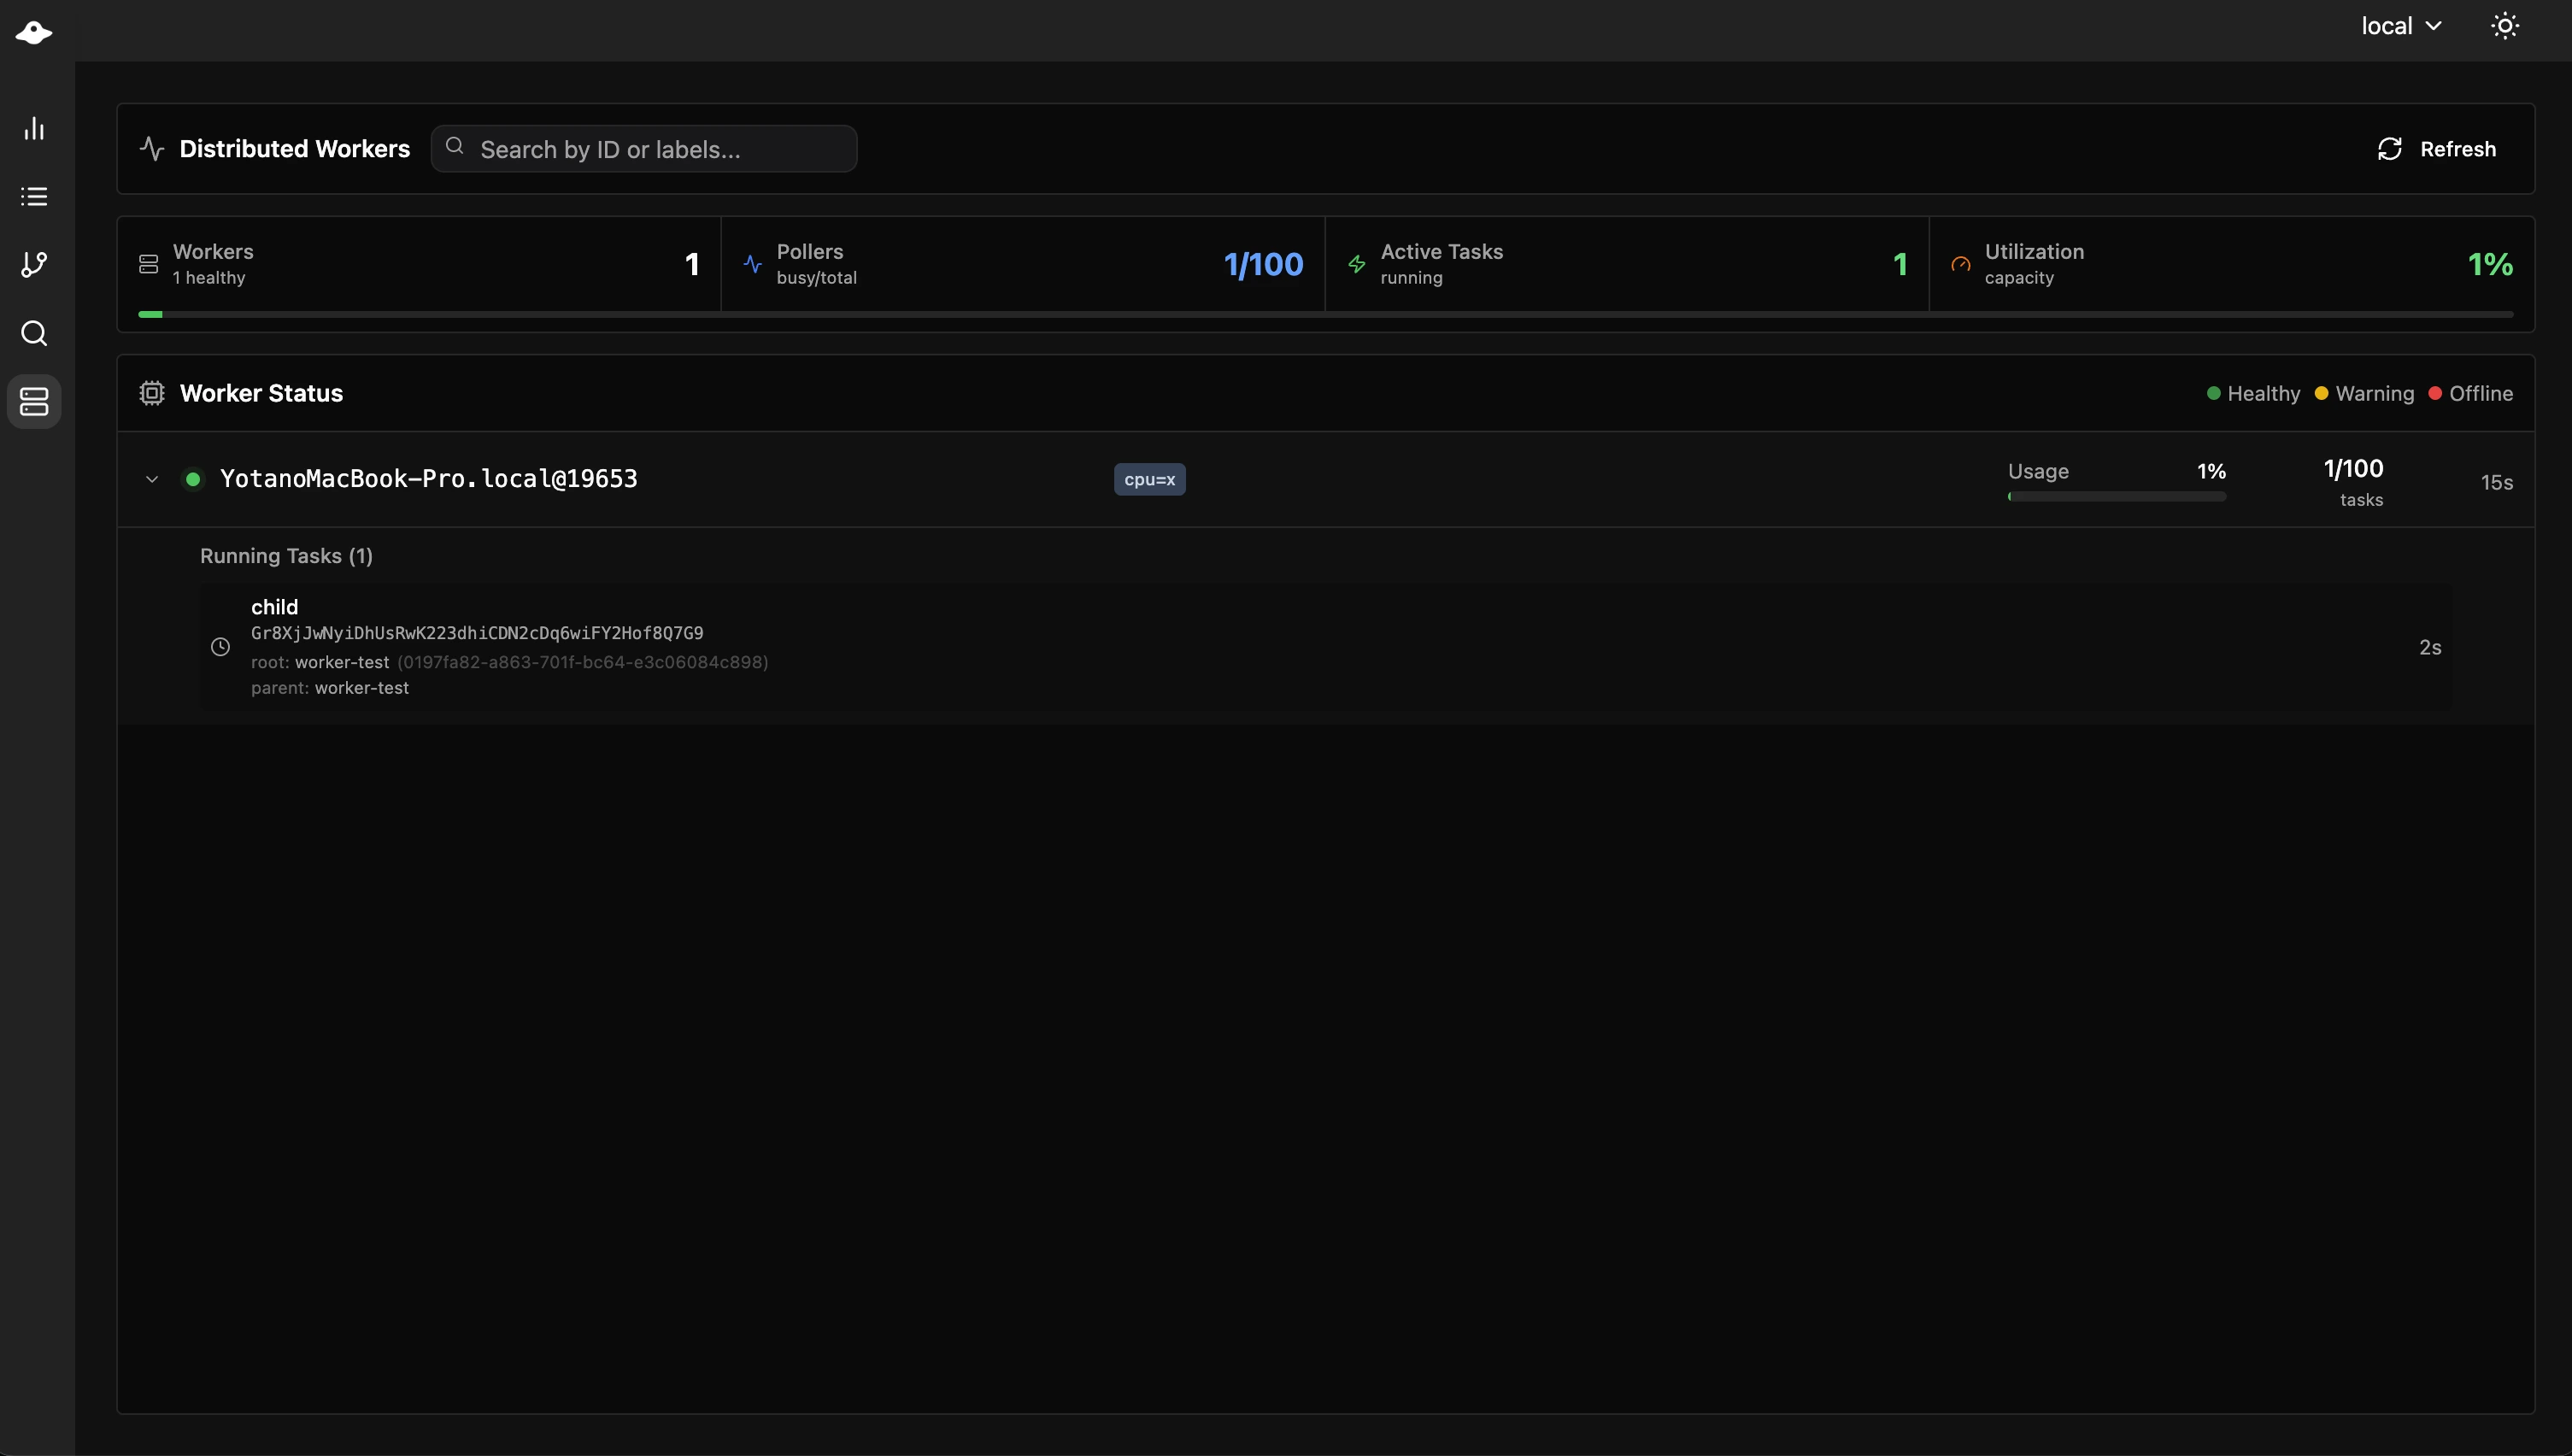
This page helps you verify:
- scheduler and coordinator availability
- connected workers
- current CPU, memory, disk, and load trends
If you use distributed execution, this is the first place to look when workers appear missing or overloaded.
Admin Pages
Depending on your role and license, the navigation can also include pages such as:
- Users
- API Keys
- Remote Nodes
- Base Config
- Profiles
- Notifications
- Incidents
- Events
- Audit Logs
- License
These pages are intended for administrators and operators rather than day-to-day workflow users.
Optional Features
Terminal
The browser terminal is disabled by default. Enable it only in environments where shell access through the UI is acceptable.
terminal:
  enabled: true
max_sessions: 5Remote Nodes
Remote nodes let one Dagu UI manage multiple Dagu servers.
remote_nodes:
  - name: production
    api_base_url: https://prod.example.com/api/v1
    auth_type: token
auth_token: ${PROD_TOKEN}Branding
You can adjust the title and accent color shown in the navigation bar.
ui:
  navbar_title: "My Workflows"
navbar_color: "#00D9FF"Security Notes
- Enable authentication before exposing the UI outside a trusted network.
- Use HTTPS for any remote or shared deployment.
- Treat terminal access and write access as admin-level capabilities.